Grant Allan, Stuart McIntyre, Graeme Roy, Fraser of Allander Institute, Department of Economics, University of Strathclyde
Yesterday’s economic figures for Scotland give us a better picture of the health of the Scottish economy and its likely resilience to coping with the heightened uncertainty post-EU referendum.
The focus of comment thus far has understandably been on the zero growth over the first 3 months of the year. Flat growth is obviously disappointing, and coupled with our expectation for what the data is likely to report for Q2, this suggests that the economy was largely on pause through the first half of the year.
What is less likely to be picked up by commentators and others are the revisions to past estimates of growth. Yet it is here that some interesting issues emerge.
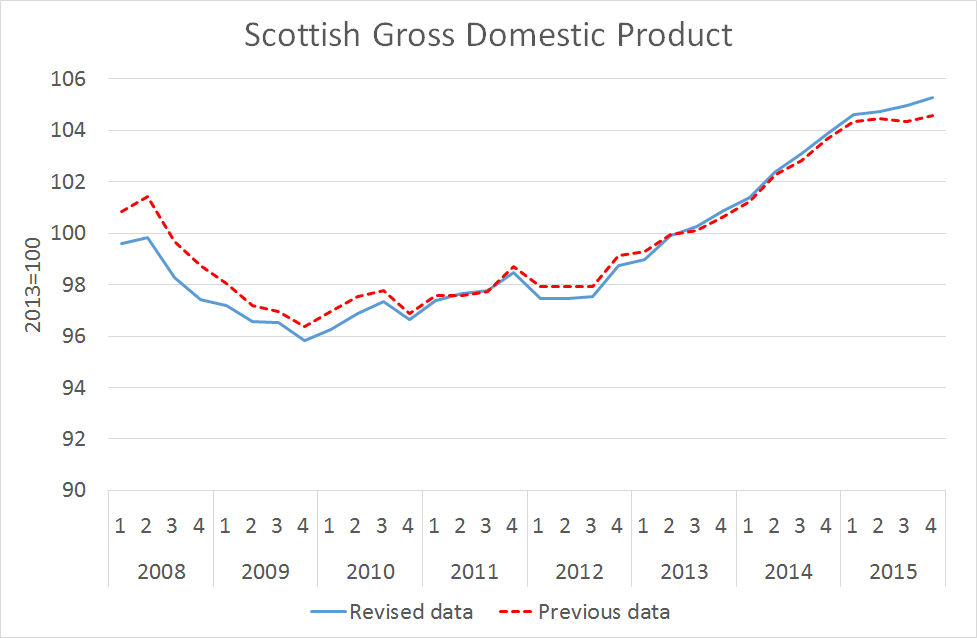
In particular, the economy is now estimated to have been more resilient through 2015 than first thought. Over 2015 as a whole, growth is estimated to have been +1.4% up from the +0.9% published for the same period just three months ago. The pre-financial crisis boom has also been revised down, with the peak to trough recession now much lower than previously estimated. The chart below shows Scottish GDP before and after the most recent data revisions.
Yesterday’s Economic Data
In Q1 of this year, services grew by 0.4% but there were sharp falls in production (down 1.2%) and construction (down 1.5%, albeit on the back of exceptionally strong growth over the past couple of years).
This led to overall GDP growth being flat at 0.0%.
How did we do on our prediction? Last week we estimated that growth would be around +0.3%. We did point out that our model tends to overestimate quarterly growth and was therefore likely to be an upper-bound – however, it is fair to say that zero growth was lower than we had been anticipating.
One reason for this is that our model can’t pre-empt the revisions to past data that were included in today’s publication. The decision to revise up Scotland’s economic performance through 2015, will clearly have a corresponding dampening impact on Q1 data for 2016. All else remaining equal, without these past revisions the Q1 data for 2016 is likely to have been higher and therefore closer to our estimate.
Another key thing to note is that each of the revisions, with the release of 2015 Q4 and 2016 Q1 GDP, have moved the official estimate of GDP closer to our nowcasts – see chart below. The first estimate of 2015 Q3 GDP was 0.08%, subsequently revised down to -0.1% with the release of 2015 Q4 data, before being revised up to 0.22% in yesterday’s data release. Our central nowcast was 0.33%.
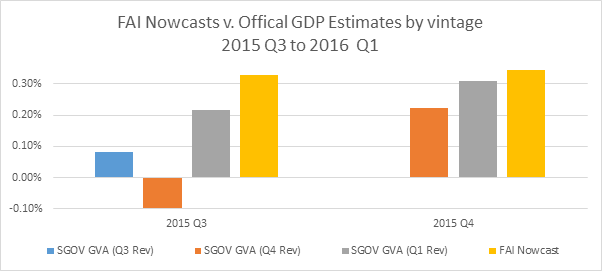
Similarly, we can see that the first release of data for 2015 Q4 put growth at 0.22%, which with the data released yesterday has now been revised up to 0.31% very close to our estimate of 0.34%. Our central estimate for 2016 Q1 was 0.29%, compared to the official estimate released yesterday of 0.0%. Based on the most recent releases of data, we may very well see subsequent revisions follow a similar pattern and close the gap between our nowcasts and the official data.
The contents of GDP
Underneath the headline figures are some interesting results.
Manufacturing output was down 2.6% over the three months and 5.4% over the year.
This undoubtedly reflects – in part – the ongoing challenges in the North Sea and its impact on the Scottish supply chain. The Metals, Metal Products and Machinery sub-sector is down nearly 23% since Q1 2014 while Refined Petroleum, Chemical and Pharmaceutical products is down over 3%.

The slowdown in oil and gas related industries is clearly one of the key drivers of the continued divergence between Scotland and the UK. Growth over the 12 months to Q1 2016 was 0.6% in Scotland compared to 2.0% in the UK as a whole (or 1.7% excluding oil and gas).
The indications are that the growth will remain relatively weak in Q2 even before accounting for the impact of the EU referendum.
In particular, the closure of Longannet at the end of March is likely to have a disproportionate impact on the Q2 2016 Scottish GDP figures – we think it could take anything up to 0.4% of the headline number. In other words, the rest of the Scottish economy would have to grow by at least 0.5% as a whole to prevent another flat (or even negative) next quarter of economic growth. It will be very important however, not to read too much into this. This is a structural ‘level shift’ in the way economic data is measures and which relates to one particular power plant in Scotland. It isn’t a sustained weakening in the economy’s overall performance (although clearly raises other issues about Scotland’s energy supply etc).
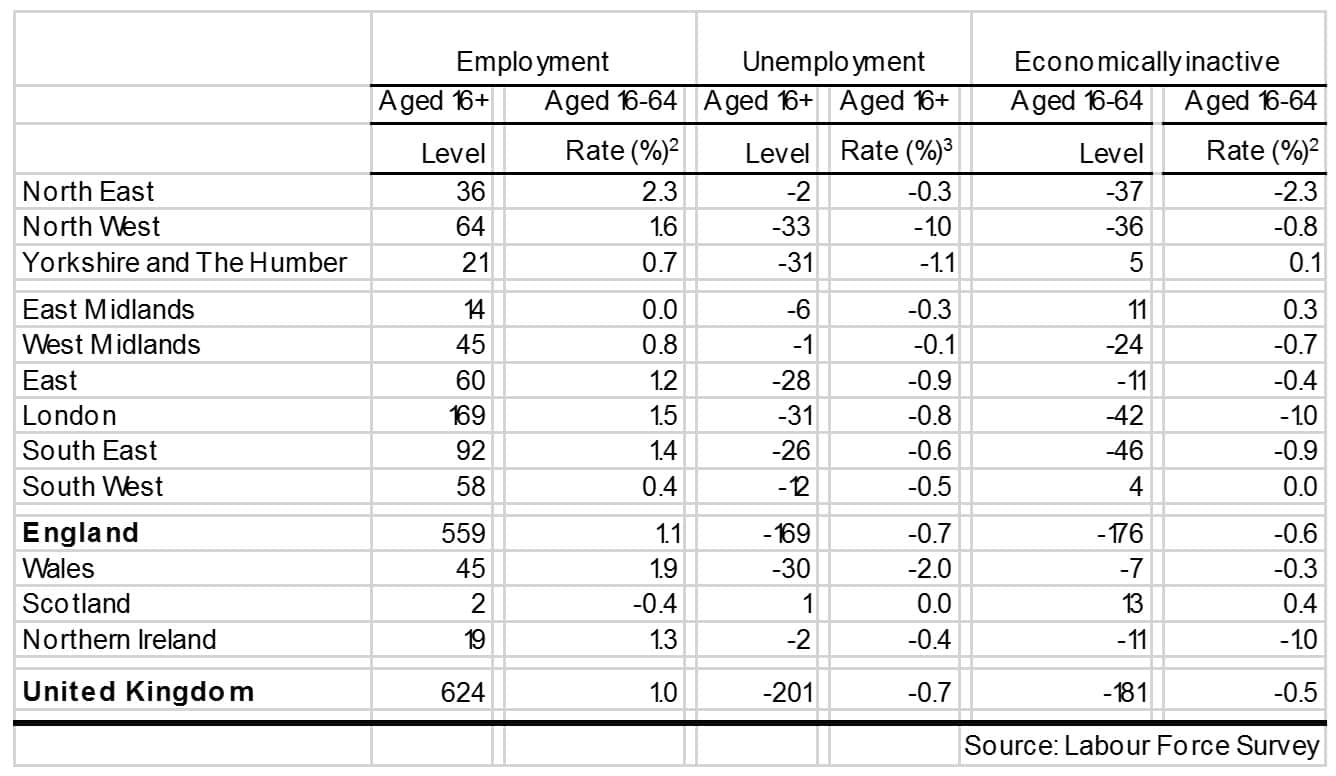
The labour market data – also published yesterday by the ONS – and which covers a slightly later period up to the end of May, showed employment rising by 17 thousand with a corresponding fall in unemployment of 18 thousand. While positive, this was balanced somewhat by an increase in economic inactivity – those neither in work or seeking work – of 11 thousand.
Table 1: Headline Employment, Unemployment and Inactivity Rates
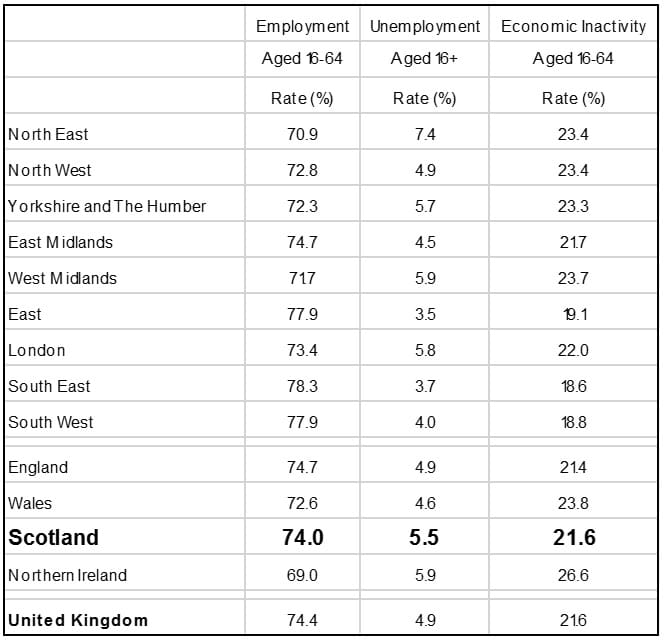
So a mixed bag, and when compared to the other parts of the UK – see below on the change over the year – Scotland’s performance isn’t as strong. Indeed, Scotland was the only part of the UK without an improving employment rate or falling unemployment rate.
Table 2: Changes in Employment, Unemployment and Inactivity Rates Over the Year
Data revisions
As we highlighted last week, every year the GDP figures go through a process of major revision – beyond what we’d normally expect from quarter to quarter.
Data revisions often given economists and statisticians a bad name. But these revisions are essential to make sure that official estimates of economic activity incorporate the most recent and comprehensive information. They aren’t some wheeze to revise past data to hide ‘bad news’ as some suggest– indeed some of the revisions published yesterday actually show that the estimates of Scotland’s weak economic performance last year may have been over-stated at the time.
Yesterday’s revisions come from two sources. The ‘UK-wide revisions’ flow from publication of the ONS Blue Book of National Accounts which contains more detailed information on some of the more complex and difficult to measure elements of GDP, which as a result are published with a much longer lag.
The ‘Scottish revisions’ stem from the annual re-weighting exercise that is used to ensure that the statistics accurately capture the structural composition of the Scottish economy.
Typically, any revisions usually net out so that the overall impact on long-term growth trends is marginal. However, they can have important implications for any interpretation of how the economy has performed at crucial points in time.
Three things jump out from the data this time.
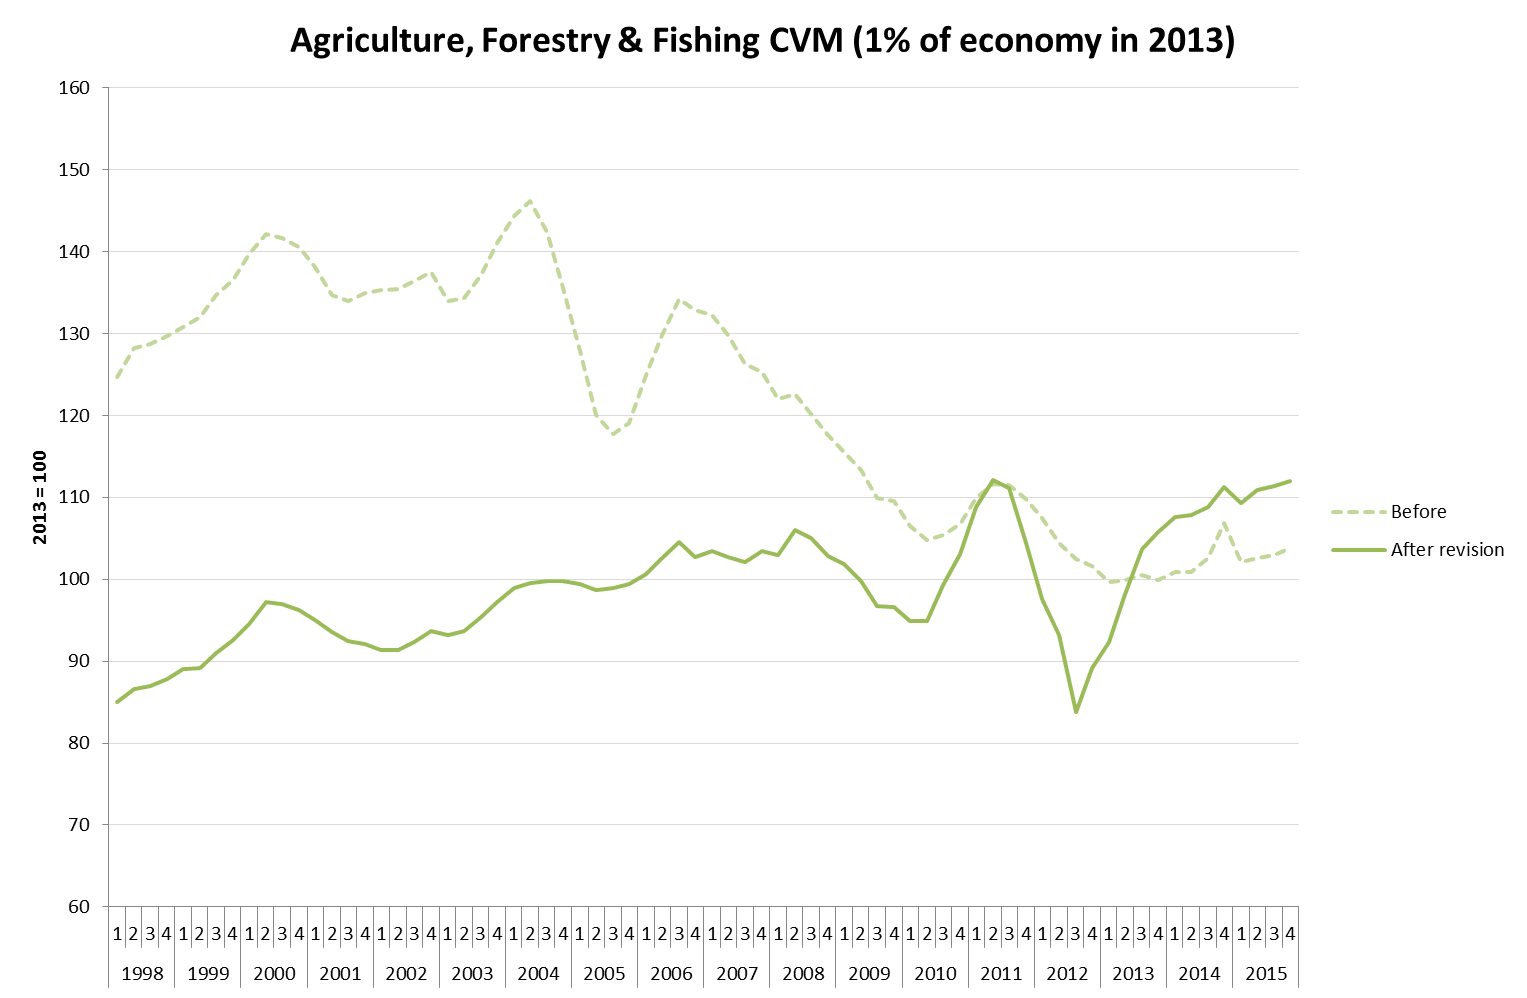
Firstly, the revisions to agriculture are not minor. The chart below is taken from the helpful ‘revisions paper’ that government statisticians published alongside the headline GDP numbers. As you can see, the various revisions have fundamentally changed the time path of the agricultural, forestry and fishing sector in recent years. Rather than declining since a peak in 2004, the sector is now projected to have grown! There are very good reasons for these revisions – documented here.
But revisions of this scale do make interpretation difficult, and challenging to explain, as although the sector is relatively small in the overall context of the Scottish economy, it clearly is a vital sector to the government’s economic ambitions, rural economies and food security.
Secondly, the revisions point to a slightly different financial crisis than we first thought. In particular, an element of the pre-boom growth has been taken off. Similarly, the scale of the ‘bust’ during 2008 and 2009 is projected to be lower. The peak to trough fall is now just 4% rather than previous estimate of 5% – see chart 1 above.
Thirdly, the revisions to the data paint a rosier picture of growth last year. The Scottish economy is now estimated to have grown in each and every quarter of 2015, with growth of 1.4% in 2015 up from the previous estimate of just +0.9%. Whilst performance was still relatively weak, compared to both the UK and trend Scottish growth, it clearly wasn’t as bad as first thought.
So what next?
There is always a lag between the time period in question and publication of official data. The GDP data released yesterday covers the period up to the end of March and the labour market data up to the end of May. They therefore cover the period before the outcome of the EU referendum. We won’t have official figures for Scottish GDP for the post-referendum period until January 2017 (only the first week after the Brexit vote will be captured in Q2 2016 estimates released this October).
What we take from the data is that it’s clear that the Scottish economy remained fragile in early 2016, that the impact of the slowdown in the North Sea continues to resonate and that the labour market is broadly flat – neither rapidly creating nor losing jobs.
Altogether, and coupled with the non-official data we have for the period up to June, the data points to a Scottish economy that was largely on pause before the EU referendum. What happens in the months ahead is highly uncertain, but the balance of evidence does not point to a rapid return to trend growth.
Authors

Head of Research at the Fraser of Allander Institute