
The size of Scotland’s economy is frequently used as an indicator of how well Scotland does compared to the rest of the UK. GDP often features in the news, for example in the current climate, where both the UK and Scotland have officially entered a recession following two consecutive quarters of negative GDP growth. But GDP isn’t just one simple figure.
This guide will discuss the difference between real GDP and nominal GDP, total GDP and GDP per head. It will discuss things like how much of the oil and gas extraction in the North Sea to include in any measurement of the size of the Scottish economy. The guide will show how the Scottish economy compares in the UK and the world.
In addition, when asking whether Scotland is a wealthy, or successful, country, we consider the debate on wider measures of success and wellbeing, i.e. looking beyond GDP. In this guide we consider several other complimentary measures.
Measuring economic activity – GDP
The most common measure of economic activity in a given geographical area (city, region, country, or even the entire world) is its Gross Domestic Product (GDP). GDP measures the value of activity within an economy in a given timeframe. There are three approaches to measure this:
- Output approach;
- Expenditure approach; and,
- Income approach
In theory, the three approaches to measurement should lead to the same answer, giving us GDP.
The three approaches to GDP measurement
Output approach
GDP = value of all services + value of all production + value of all construction + value of all agriculture, forestry and fishing
The output approach measures the value of all goods and services produced in the economy. This allows the measure to be split into industrial sectors, such as manufacturing, or mining and quarrying, at varying levels of detail depending upon the desired analysis. The output approach therefore allows us to look at which sectors are increasing in size or declining over time.
During the Covid-19 pandemic, it helps us understand which sectors are particularly affected by lockdown measures. It is also an approach used across countries, which allows us to compare different economies.
At the highest level, GDP is divided into four sectors: services, production, construction, and agriculture, forestry and fishing.
By far the largest is the services sector, comprising around 75% of Scotland’s economy in 2019. This is followed by production (mining and quarrying, manufacturing, electricity and gas supply, and water supply and waste; 18%), construction (6%) and agriculture, forestry, and fishing (1%).
As economies develop, one can observe a common trend: the relative size of the agricultural sector declines. At the same time, the relative size of the services sector increases. In developed economies like Scotland, the agricultural sector is minimal, while the services sector is the largest by far. However, for easy comparison across countries, it is sensible to continue reporting the size of the agricultural sector.
Expenditure approach
GDP = consumer expenditure + government expenditure + capital investment + exports – imports
The expenditure approach measures the value of goods and services bought in Scotland. This is done by adding consumer and government expenditure, capital investment, and the net of exports less imports. It is important to include the last component.
For example, in 2019, total (private and government) expenditure and investment in Scotland was valued at around £175 billion. But Scottish GDP was ‘only’ £168 billion.
Where did the £7 billion go? The answer is net exports (or rather, imports): in 2019 Scotland imported more goods and services than it exported, a difference valued at £7 billion. So, while Scottish households, firms and governments spent £175 billion, some of this money went towards goods and services produced elsewhere, and this was not entirely offset by Scottish goods and services sold abroad. Scottish GDP measures the value of goods and services produced in Scotland, meaning we do not include this £7 billion in Scottish GDP.
Income approach
GDP = employee compensation + gross operating surplus + taxes on products and production less subsidies
The income approach measures all income earned in the economy. There are several ways to measure this. The approach taken by the Scottish government is to include the pre-tax income of all employees in Scotland, the gross operating profits of companies in Scotland (which includes the income of the self-employed), and the taxes less subsides on production and products. Figures for 2019 show that employee compensation makes up almost half of GDP, while gross operating profits are around 38%.
A BRIEF ASIDE
Work with us
We regularly work with governments, businesses and the third sector, providing commissioned research and economic advisory services.
Find out more about our economics consulting services.
GDP statistics
In the Scottish GDP statistics, the output approach is used exclusively for the ‘First Estimate’ of quarterly GDP, as well as the newly published monthly GDP data. It features alongside the other two approaches in the second estimate of GDP within the Quarterly National Accounts (QNAS).
The output approach is the only approach for which estimates are produced in both nominal and real terms (more on this distinction later), with the expenditure and income approach featuring in nominal terms only.
You might be wondering why there are three separate publications of GDP figures. The monthly estimates are a recent phenomenon, first published by the Scottish government for April 2020.
Usually, GDP is measured on a quarterly basis, dampening the effect of fluctuations that could occur between individual months. However, during the current Covid-19 pandemic, we are interested in precisely these month-to-month fluctuations. They help us better understand the effect on the economy of being in lockdown, as well as the size and speed of the subsequent economic recovery.
For quarterly GDP, the second estimate (within QNAS) often contains revisions of the data published in the first estimate. GDP figures rely on estimates, and as more or better data becomes available over time, it is important to revise these estimates to improve the accuracy of GDP figures.
Typically these revisions are minor, but sometimes they can be rather significant, for example when a new data source is used or the methodology is updated.
As can be seen in the chart using 2019 figures, all three approaches lead to the same estimate for Scottish GDP.
Chart 1: Scottish GDP, output, expenditure and income approach, 2019
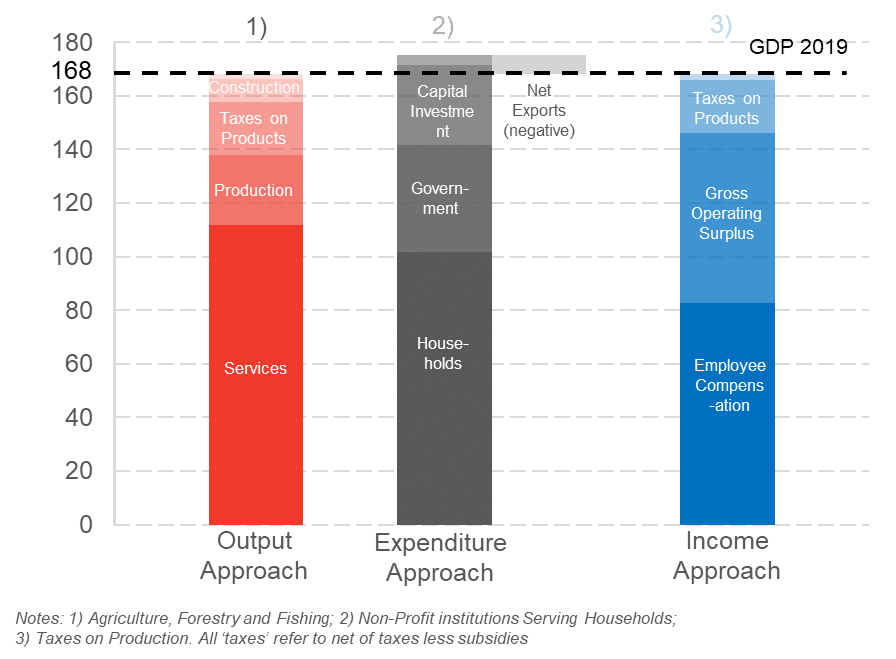
Source: QNAS Q1 2020
Why do we call it GDP and not just ‘output’?
You might have heard the term ‘Gross Output’ used instead of GDP when referring to the size of an economy. However, these measures differ in an important way. Gross output measures the value of all goods and services sold, including intermediate goods. Intermediate goods are those which are bought by firms and then used in the production process for another product. GDP on the other hand measures only the value of final goods and services, avoiding the double-counting of intermediate goods.
To understand this difference, consider the example of a burger bought in a pub:
A pub needs to buy the burger’s ingredients: a patty (£1), buns (50p) and cheese, lettuce, tomatoes and other toppings (50p). While the pub pays £2 for these ingredients, it will sell the finished burger for £6 to its customers.
In this example, there are two transactions: the pub pays its supplier £2 for the ingredients, and a customer pays the pub £6 for the burger. Adding these two transactions gives a gross output of £8. However, when measuring GDP, we consider only the value of the ‘final’ product – the burger. This means that the contribution to GDP would only be £6, not including the price paid by the pub for the intermediate products (i.e. the ingredients).
Another way to look at this is to consider the ‘value-added’ of each transaction. This means looking at how much value has been added by a firm when transforming intermediate products into final products. In our example, the pub adds £4 of value by ‘transforming’ the raw ingredients into a finished meal. Assuming the value-added of the ingredients is equal to the price for which the pub buys them from the supplier, the total contribution to GDP is the sum of the value-adds of the individual transactions, so £2 + £4 = £6.
This example shows that gross output will always be higher than GDP (and, when viewed on a national scale, by quite a lot). Considering the monetary value of every transaction appears sensible from an accounting standpoint – for example, when looking at the revenues and profits that firms make. However, most would argue that it overstates the actual value of what is produced in an economy.
GDP calculations consider the value of final products only, avoiding the double-counting that is included in gross output.
How wealthy is Scotland? Headline GDP figures for 2019
No matter which of the three approaches is used, if measured correctly the same value for GDP is calculated. Yet, we often hear different terms used: real and nominal GDP, aggregate and per head. This section explains these terms and presents the headline figures for Scotland in 2019.
Nominal GDP: £168 billion
Nominal GDP refers to GDP measured at current prices and is the primary figure used when describing the size of an economy as a whole. However, it can be misleading to use nominal GDP when comparing the size of the economy over time. To understand this, consider the following example:
Suppose Alice and Ben are the only producers in an economy. In 2018, Alice grows ten kilos of apples, which she sells to Ben for £1 per kilo. Ben bakes five loaves of bread, which he sells to Alice for £2 per loaf. The size of this economy can be calculated as follows: (price of apples * kilos of apples bought) + (price of bread * bread loaves bought) = (1*10) + (2*5) = 10 + 10 = £20
In 2019, the price level in the economy doubles. That is, a kilo of apples costs £2, while a loaf of bread costs £4. Alice and Ben buy the same amount of bread and apples as last year. With the new prices, the size of the economy becomes: (2*10) + (4*5) = 20 + 20 = £40.
In this example, the size of the economy has seemingly doubled. But are Alice and Ben twice as well off in 2019 than in 2018? Can they afford twice as much? Have they produced twice as much? The answer to all of these questions is no.
While it is true that the nominal value (i.e. the number of Pounds) of Alice’s and Ben’s earnings has doubled from £10 to £20 each, what they can buy with their earnings remains constant: ten kilos of apples or five loaves of bread. The change in the economy’s price level (known as inflation) makes it appear that the economy has grown (by a lot), while in ‘real’ terms, it remains unchanged. That is why, instead of nominal GDP, analysts use real GDP when looking at changes in GDP over time.
Real GDP: £157 billion (in 2016 prices)
Real GDP refers to GDP measured with regard to ‘benchmark’ prices. This means that the prices for goods and services in one year are taken (the base year), and for all other years, GDP is measured as if prices hadn’t changed. Therefore, real GDP controls for changes in the price level (inflation).
In other words, while changes in nominal GDP reflect changes in both prices and the amount of goods and services sold, changes in real GDP are affected only by the latter.
Scottish and UK statistics currently use 2016 as their benchmark year. When reporting GDP growth figures, real GDP is used, as this reflects the change in size of the economy more accurately. Over time, the change in real GDP is much less pronounced than the change in nominal GDP.
The chart below shows that while nominal GDP has more than doubled since 1998, the change in real GDP has been more moderate. It also shows a drop in GDP during the financial crisis in 2008-2009. This reflects the state of the economy more accurately than nominal GDP, which remained almost unchanged during the same period.
Chart 2: Scottish GDP, nominal and real, 1998-2019
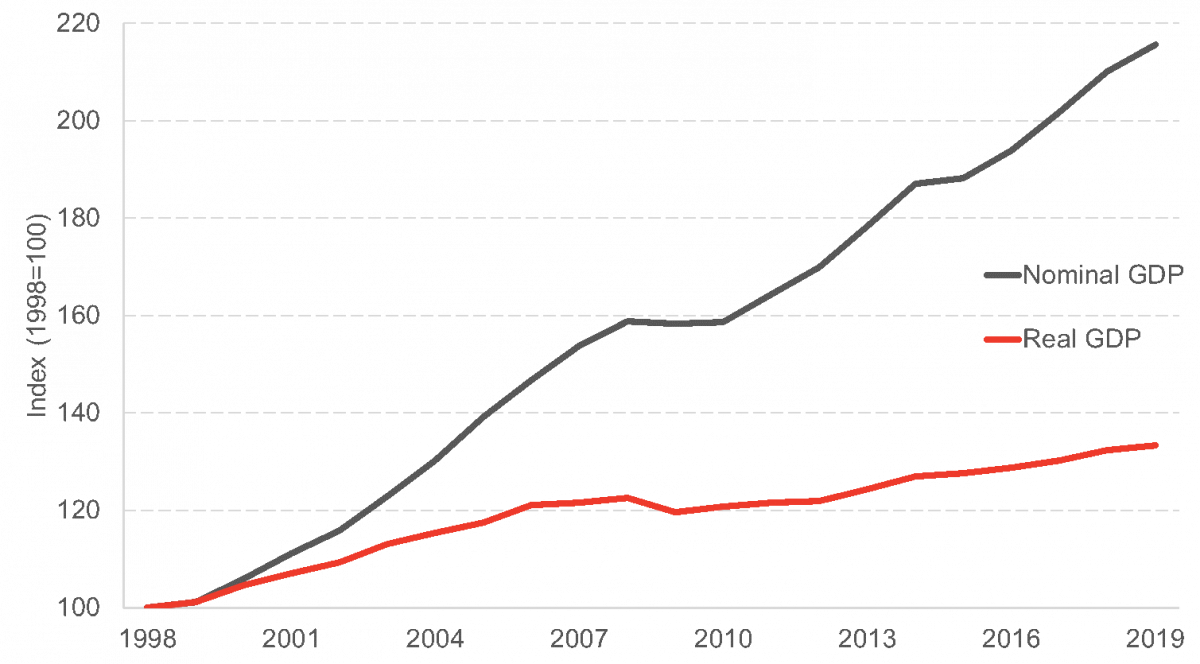
Source: QNAS Q1 2020
Issues when comparing real GDP figures
We have just explained why real GDP figures give us a more accurate picture of the state of the economy than nominal GDP. Therefore, it seems sensible to use real GDP when comparing different regions in Scotland or the UK. However, some caution is warranted.
The Scottish Government’s GDP methodology outlines the methods used to derive official GDP statistics for Scotland. The methods used, wherever possible, mirror the approaches used by the ONS in the production of the UK’s short-term measurement of GDP, to help ensure the figures are comparable.
In broad terms, two main approaches are used: direct volume measures and turnover measures which are deflated to measure growth in real terms.
One of the main sources of the Scottish Government’s quarterly GDP statistics is the ONS’ Monthly Business Survey (MBS).
The MBS collects information from business units and Scottish GDP estimates are derived from businesses with branches in Scotland. For businesses operating in other parts of Great Britain, a share of GB turnover is allocated to Scotland based on their employment in Scotland.
Like most economic statistics, estimates have to be deflated to make different years of data comparable in real terms. MBS data requires deflation. The Scottish Government uses the ONS’ price deflators. These deflators are predominantly based on –
- producer price indices;
- export producer price indices;
- services producer prices; and,
- consumer prices.
Currently, there are no regional price indices produced meaning UK price information is used for the Scottish Government’s GDP statistics. Due to national price estimates being sufficiently detailed, national price changes are used to deflate output in the majority of Scottish industries.
However, for some industries, changes in output are better captured using direct volume measures. This includes the public sector and many parts of manufacturing and utilities, where the volume of production can be more easily captured.
For example, electricity supply is measured by the volume of electricity supplied (kilowatts per hour) and is therefore a direct volume measure.
For non-market industries, such as health care or education, output is measured directly and is based on the levels of services provided. I.e. the NHS services are estimated by the number of procedures carried out and the cost of each procedure.
The Scottish Government’s GDP estimates are the primary measure of growth for the Scottish economy.
However, through the production of Regional Accounts, the ONS also produces real terms estimates of annual growth in all NUTS 1 areas of the UK, including Scotland. These annual estimates are produced in a different way, as the regionalised current price measures are deflated using UK deflators.
This means, particularly where direct volume measures are used in the production of Scottish GDP by the Scottish Government, growth will look quite different if using the ONS measures. So, it is worth bearing in mind these caveats if using this data.
To understand this, the graph below compares the chained volume measures (CVM) used by the Scottish government and the ONS for calculating real GDP.
Chart 3: Real GDP, Scotland, ONS & Scottish Government estimates, 1998-2018
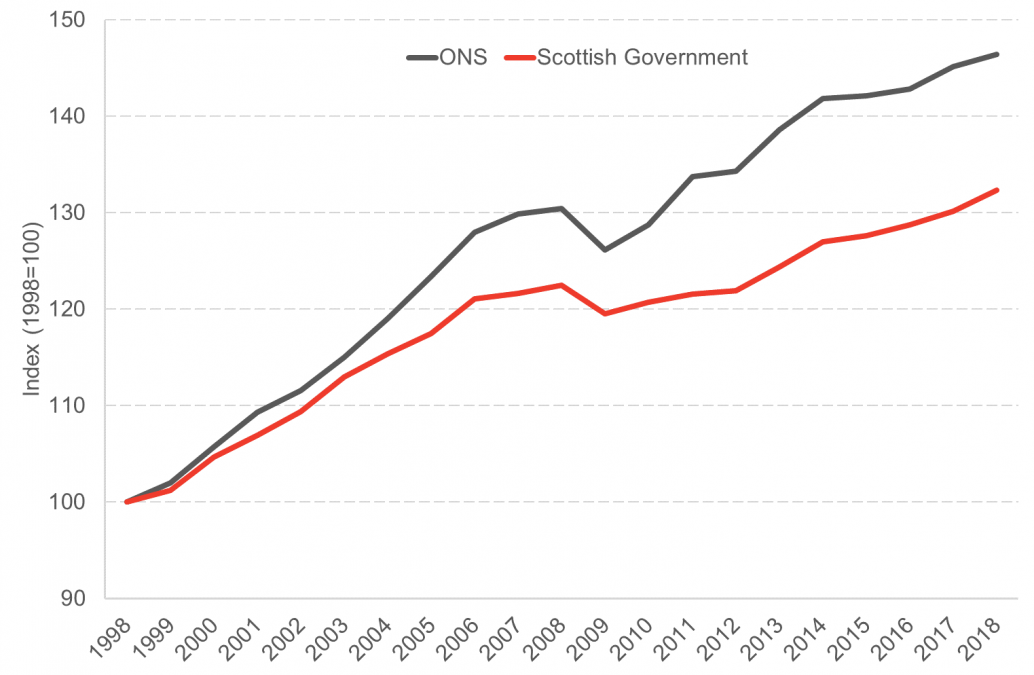
Sources: QNAS Q1 2020; ONS(a)
We see a significant discrepancy between the two data sources. Similarly, we can look at the chained volume measures used for calculating real GVA (Gross Value Added). GVA is GDP less the net of taxes and subsidies on products (more on this distinction later).
Chart 4: Real GVA, Scotland, ONS and Scottish Government estimates, 1998-2018
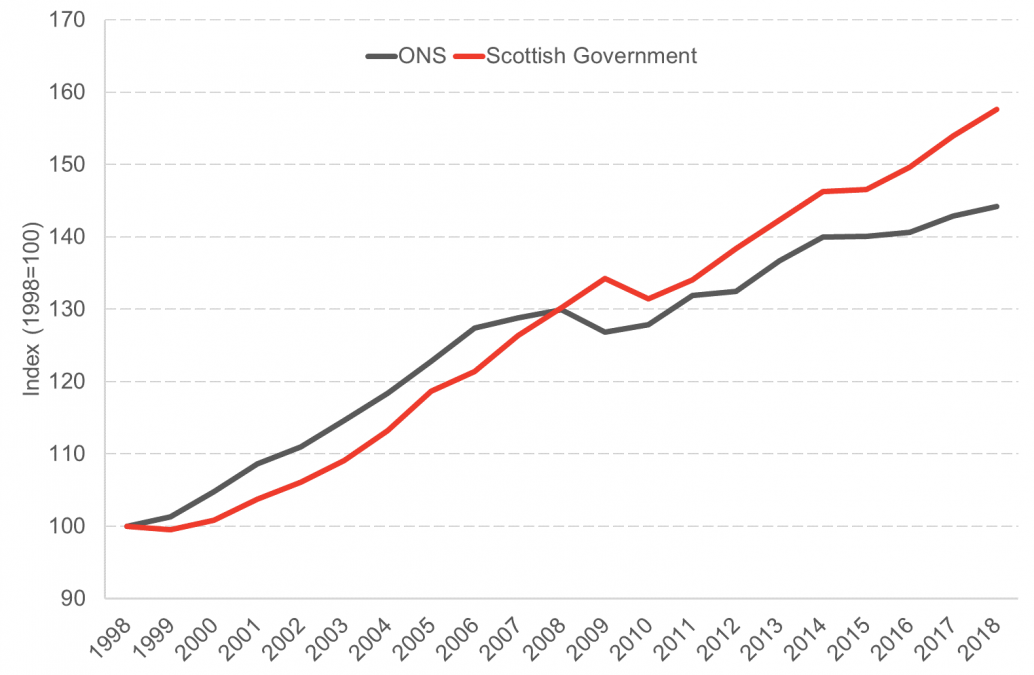
Sources: QNAS Q1 2020; ONS(b)
While we prefer the Scottish government’s approach, figures aren’t available from this source for a comparison of GDP or GVA of Scottish regions, or the four constituent nations of the UK. For such comparison, we rely on the ONS’ data. Therefore, throughout this guide, when ONS data is used we will present nominal instead of real figures for GDP and GVA.
While these figures indicate how large the overall Scottish economy is, they don’t tell us much about how wealthy Scotland is. Consider, for example, India, which had a nominal GDP of around £2.2 trillion in 2019[1]. India’s economy, by this measure, is about 13 times larger than Scotland’s. But India’s population is much larger than Scotland’s.
While population is by no means a definite predictor of an economy’s GDP, there is undoubtedly a strong link between the two: all else equal, a country with a larger population has both the ability and the need to produce more food, clothes, cars, haircuts and all other goods and services for its population.
Therefore, using aggregate GDP figures is not always the best way to compare different economies. Instead, we can compare GDP on a per head basis.
GDP per head: £30,800 (nominal); £28,700 (real, 2016 prices)
GDP per head is simply an economy’s GDP divided by its population. The chart below shows that the growth rates between total GDP and GDP per head can vary. In fact, in 2007, total GDP grew slightly, while GDP per head decreased.
Why the discrepancy? As already mentioned, total GDP is likely to increase when the population grows. However, the population can grow at a faster or slower rate than GDP. When the GDP growth rate is smaller than the population growth rate, then GDP per head will decrease: even though the pie has become larger, relatively more people want a piece, so each person’s share of the pie is smaller than before.
Chart 5: Real GDP growth, Scotland, total & per head, 1998-2019
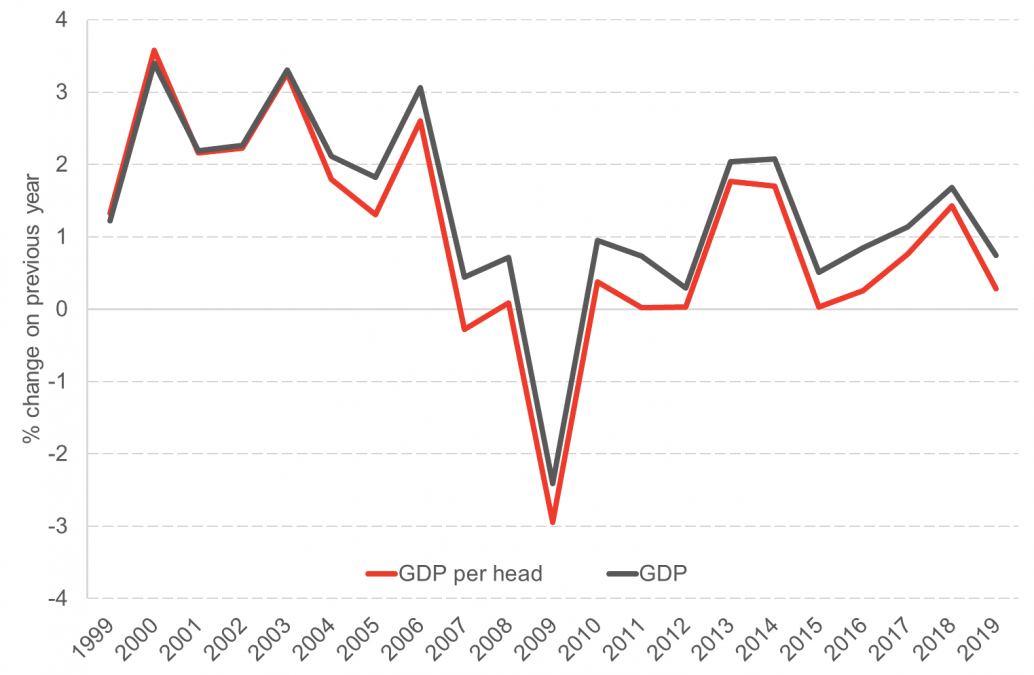
Source: QNAS Q1 2020
How do Scotland’s figures compare?
UK comparison
As described previously, GDP per head is well-suited to compare different countries and regions. Therefore, it is natural to ask how the four nations of the UK compare to each other.
To answer this question, we can look at ONS figures for the UK and its four constituent nations from 1998-2018.
Chart 6: Nominal GDP per head: four nations and UK, 1998-2018
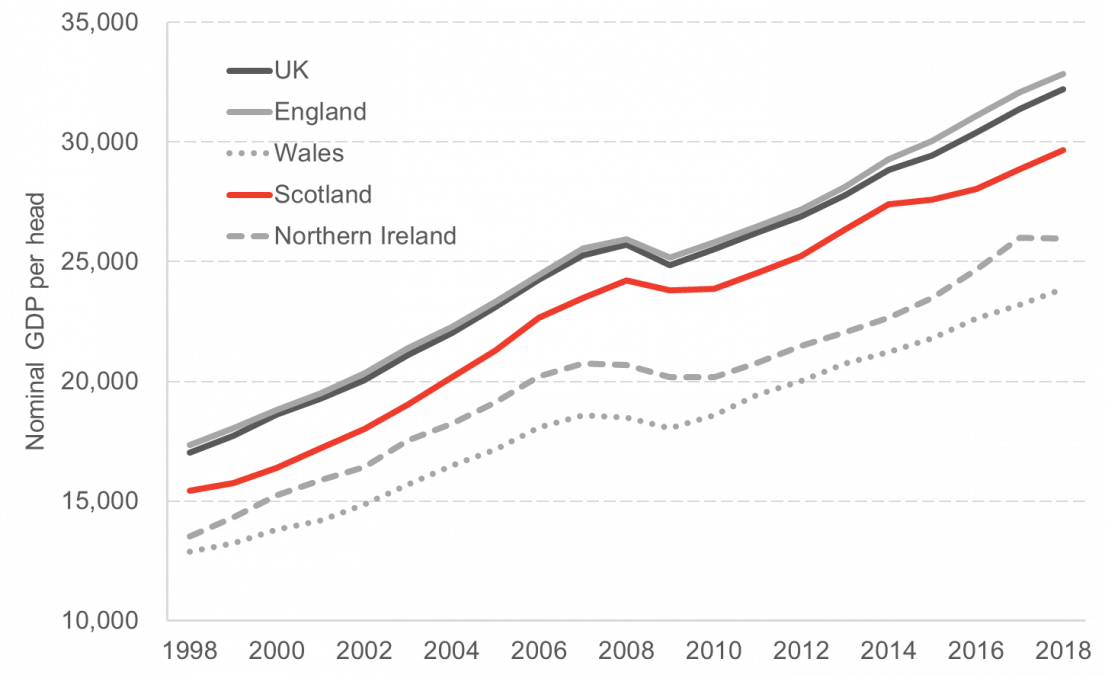
Source: ONS(a)
Over time, Scotland has consistently taken the second ‘rank’ among the UK’s four nations: Scottish GDP per head is lower than England’s (and the UK’s), but higher than Wales’ and Northern Ireland’s.
But this isn’t the whole story: the above graph excludes what the ONS calls ‘Extra-Regio’ activity, which is any economic activity that cannot be assigned to a specific region in the UK. In practice this includes activities by UK diplomatic missions and defence forces abroad, however it predominantly consists of the extraction of oil and gas.
GDP: including offshore activity
Including the extraction of oil and gas in Scottish GDP figures can be controversial, not least because it may imply ownership of the natural resources. It should be mentioned here that the onshore Scottish GDP figures mentioned so-far do include economic activity related to the oil and gas sector – so long as this activity does actually take place onshore. It is the actual extraction of oil and gas in the North Sea that is excluded from these figures.
Given the volatile nature of the industry, the size of this ‘offshore sector’ can vary greatly across different years – price fluctuations in the global oil and gas market undoubtedly affect how much North Sea oil and gas extraction is financially viable.
The chart below shows the size of extra-regio economic activity as a percentage of onshore activity for the UK and for Scotland.
For Scotland, there are two measures: the population share attributes a percentage of UK extra-regio economic activity to Scotland equivalent to the share of the Scottish population in the overall UK population. The geographical share attributes the oil and gas extraction occurring in ‘Scottish adjacent waters’ to Scottish GDP. The Scottish government uses this latter measure in its headline GDP per head figures.
Chart 7: Size of the ‘extra-regio’ economy, Scotland & UK, 1998-2018
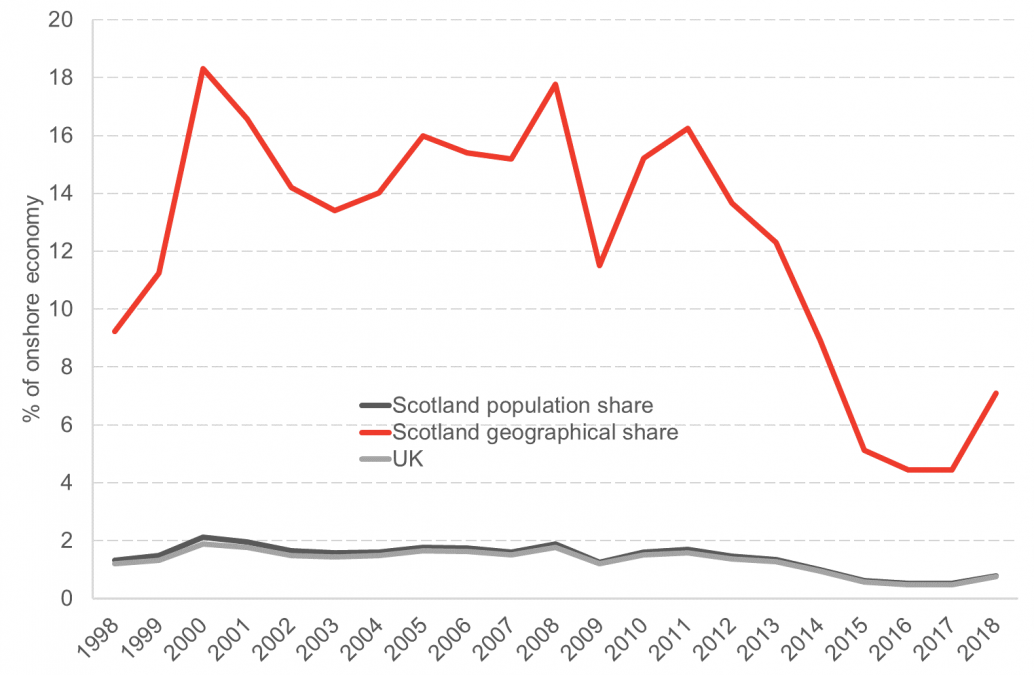
Notes: Scottish Government figures used for Scotland, ONS figures used for UK. Geographical share includes a population share of extra-regio activity other than oil and gas extraction.
Sources: QNAS Q1 2020; ONS(a)
For the UK as a whole, ‘extra-regio’ economic activity is minimal relative to the onshore economy, barely surpassing 2% of the onshore economy’s size over the past two decades. When attributing a population share of ‘extra-regio’ activity to Scotland, a near-identical trend is observed.
However, when attributing the extraction of oil and gas in Scottish adjacent waters to Scotland’s GDP, the figures are different. The size of this activity has been as large as 18% of Scottish onshore GDP. While there has been a sharp decline in recent years, it still stands at around 5%.
Including the extraction of North Sea oil and gas in Scottish GDP can affect these figures significantly. We show below how Scottish GDP per capita compares to the UK’s once oil and gas is included.
Chart 8: Scottish and UK nominal GDP per head, onshore and including offshore, 1998-2018
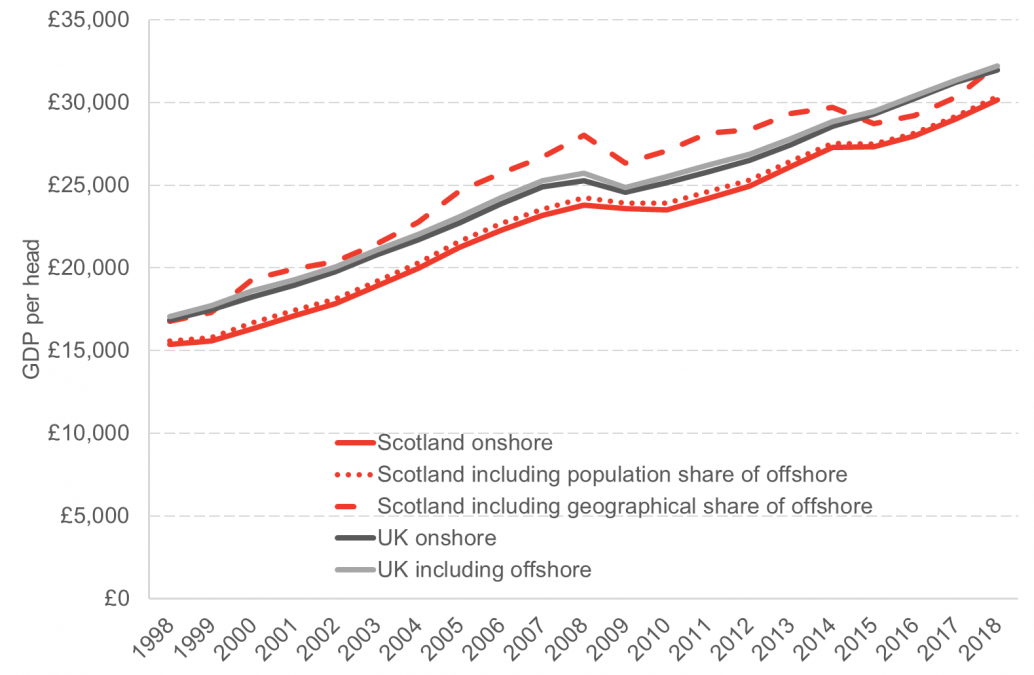
Sources: QNAS Q1 2020; ONS(a)
In most years, Scottish GDP per head is larger than UK GDP per head, when a geographical share of North Sea oil and gas extraction is included. Some may therefore be inclined to report this figure, and even imply that the average Scot is better off than the average person in the UK as a whole. That is a strong claim to make, and one that requires some caveats, which we will discuss further down.
International comparison
Another question that should be asked is how these Scottish figures compare not only to the other UK nations, but internationally. This necessitates the introduction of another slightly different measure, which is commonly used to compare GDP per head across various different regions.
Different countries of course have different currencies. It therefore makes sense to use a single currency in a cross-country comparison. In 2019, the UK’s GDP per head was £33,164 and Germany’s was €41,508. Because of the different currencies, it isn’t immediately apparent which country has the higher GDP per head. But there is another factor that isn’t as obvious: Even after exchanging currencies, the prices of the same goods and services can differ vastly among different countries.
To deal with such discrepancies, we use a measure called purchasing power parity (PPP). The measure used to compare different countries is called GDP per head in US Dollars at purchasing power parity – in short: GDP per head ($PPP).
To calculate the respective value for individual countries we don’t just convert from the country’s currency to the US$ at conventional market exchange rates. Rather, the so-called ‘real exchange rate’ is used, which is the exchange rate that would exist if price levels were equal across different countries. As we are using US$, in practice, this means comparing countries as if they all had the same price level as the United States.
A simpler version of this method is The Economist’s ‘Big Mac Index’. The index looks at the price of a Big Mac across countries, and then determines the real exchange rate as the exchange rate at which a Big Mac would cost the same.
So, with all that being said, how does Scotland compare internationally? The figures for 2019 indicate that Scotland is doing fairly average among other OECD countries.
Chart 9: GDP per head, 2019
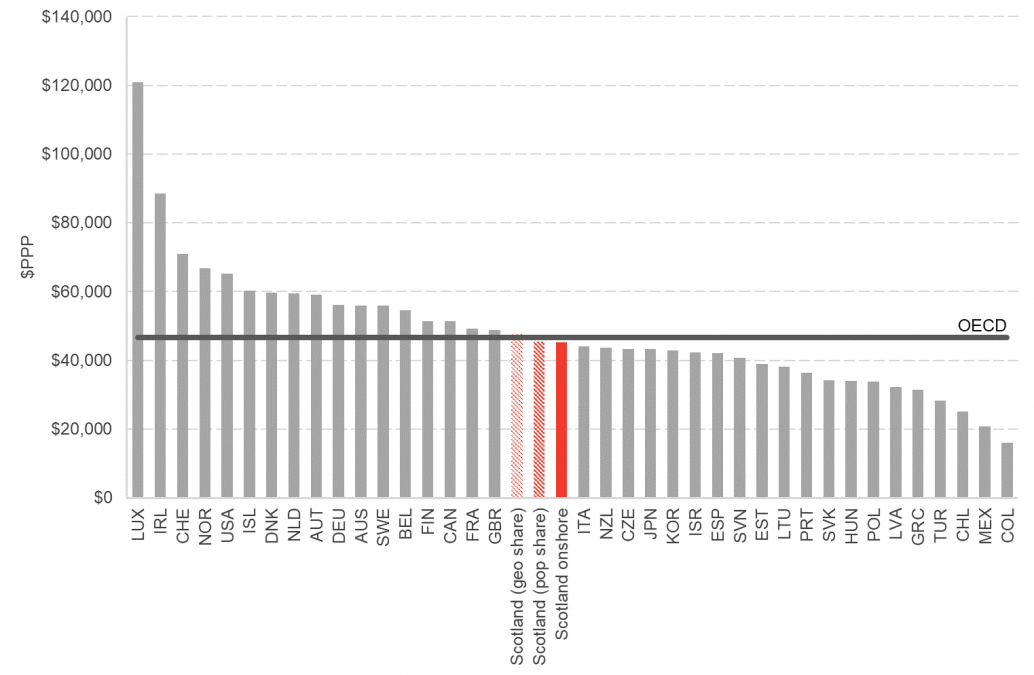
Source: OECD
Scotland’s (and the UK’s) GDP per head at purchasing power parity was lower in 2019 than what we would consider some of the traditionally wealthiest countries: the Scandinavian countries, the US, Germany, France or Australia.
Significantly however, when including a geographical share of oil and gas, the number for Scotland was higher than the OECD average (an organisation of mostly rich countries). And even when ‘only’ a population share of oil and gas is considered, the Scottish figure is slightly higher than Italy’s, New Zealand’s, Japan’s and South Korea’s – all countries that many people would consider ‘wealthy’.
Scotland appears to be doing well by one of the most significant measures of economic performance used and recognised internationally. Looking at GDP on a per head basis implies some sort of average, so one may be inclined to conclude that a strong GDP per head figure in Scotland means the average Scot’s annual earnings should be just as strong. One major issue with this is that GDP is not necessarily a good indicator of the income/wealth of people in an economy, and we will turn to this issue soon.
First however, we should consider a more mundane issue which is inherent in any measurer of an average – the effect of extremes and the potential for large variance. In our case, we want to look at the differences in economic activity across different regions of Scotland.
Measuring the economic activity of Scottish regions – Gross Value Added (GVA)
GVA = GDP – taxes on products and production + subsidies on products and production
Recall that for both the output and income approach of measuring GDP, one component is the net of taxes less subsidies. Indeed, the prices of the final goods and services we use to measure GDP (for the output and expenditure approaches), are the prices that the buyer pays – i.e. inclusive of any tax. Taxes (and subsidies) on products or production alter the prices without adding any economic value, and remember that what GDP really tries to measure is the ‘value-added’ of different actions and transactions in the economy.
Ideally, we want to measure only this ‘pure’ value of economic activity, without any distortionary effects of taxation. GDP less the net of taxes and subsidies on products and production is called Gross Value Added (GVA), or sometimes ‘GDP at basic prices’ (as opposed to ‘market prices’).
To understand the relevance of using GVA for regional comparison as opposed to GDP, consider the following example:
Two UK regions, region A and region B, produce only chocolate and books respectively. Region A’s total chocolate sales in 2020, and therefore its GDP, is £15,000. Region B’s GDP from book sales is £14,000.
In the UK, chocolate is subject to the standard VAT rate of 20%. So, we deduct this tax by dividing GDP at market prices by 1.2: 15,000/1.2 = £12,500. Region A pays £2,500 VAT on its chocolate sales. After deducting VAT, we are left with GDP at basic prices, or region A’s GVA, which is £12,500.
Books fall under the zero VAT rate, meaning there is no VAT levied on them. Therefore, region B’s GVA is exactly the same as its GDP at market prices: £14,000.
In this example, we see how a regional comparison can change when we look at GVA instead of GDP at market prices. With the latter measure, region A’s GDP is £1,000 higher than region B’s. However, region A’s products are subject to taxation, while region B’s are not. Once this is considered, the actual value of economic activity in region A is £2,500 less than GDP at market prices implies. This means that region A’s GVA is £1,500 lower than region B’s GVA. We would now say that economic activity is larger in region B than in region A, but this wasn’t apparent when looking at ‘regular’ (i.e. at market prices) GDP figures.
Having established the importance of distinguishing between GDP at market prices and GVA (GDP at basic prices), we can compare different Scottish regions.
Chart 10: GVA per head, nominal, Scotland, 2018
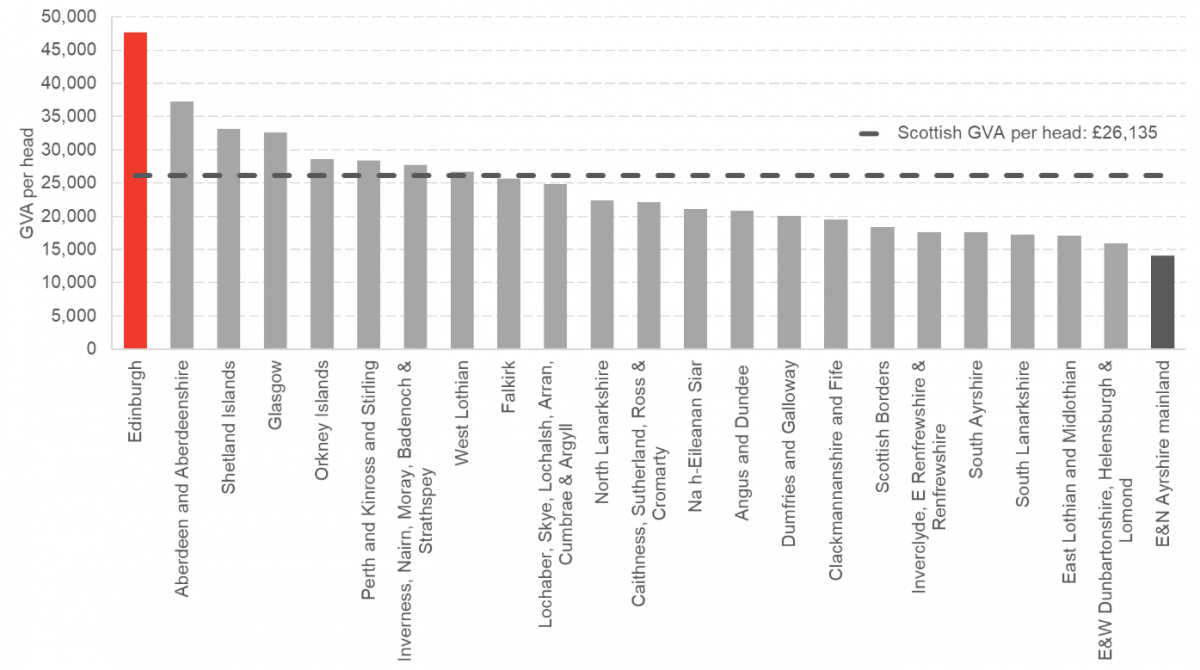
Source: ONS(a)
Scottish GVA per head was £26,135 in 2018. But there were huge variations: Edinburgh’s GVA was almost twice as large, at over £47,000. On the other hand, East and North Ayrshire’s GVA was just above £14,000 – the lowest of all Scottish regions.
However, some caution is warranted. Looking at economic data of such relatively small areas contains a larger risk of statistical error. To highlight this, let’s look at GVA per head of the Scottish regions over time.
Chart 11: Nominal GVA per head, 1998-2018
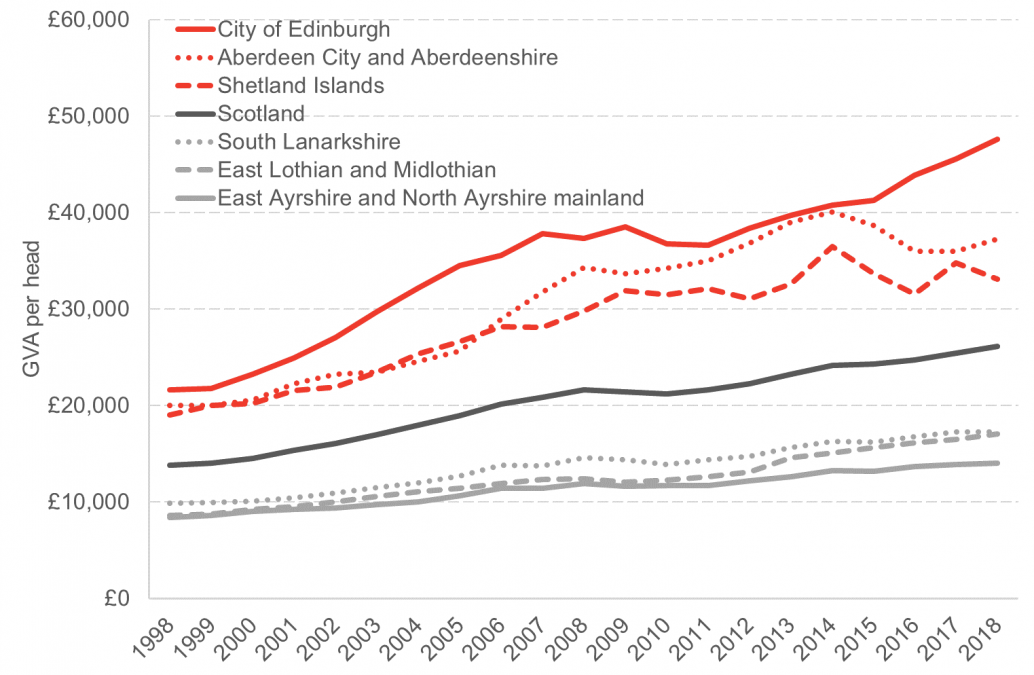
Source: ONS(a)
Looking at the Shetland Islands, there has been quite some volatility in GVA, with several peaks and troughs over the past years.
One reason for this could be statistical errors or simply the difficulty of attributing certain production to a specific region. As mentioned previously, this highlights the necessity for revising GVA and GDP figures as new data becomes available.
Another reason could be the importance of the oil and gas sector to the Shetland economy. It is not uncommon that a specific region is specialised on very few industries, and so the size of its economy will be much more strongly linked to the condition of that industry than is the case for an entire country.
Regardless of these caveats to using regional data, the chart clearly shows that over the past 20 years there have always been some regions – like Edinburgh, Aberdeen and the Shetland Islands – which have had a far higher GVA per head than other regions – like East and North Ayrshire or East Lothian and Midlothian.
All of this is to say that Scottish GDP (or GVA) per head tells us quite little about how well-off individuals in Scotland are. Even if GVA was equivalent to annual income, that would mean the average person in Edinburgh earns over three times as much as the average person in Ayrshire.
Sure, Scottish GDP/GVA per head represents the average economic activity per person in Scotland, but this won’t really mean much to many people who live in places where average economic activity is much larger or smaller than this Scottish average.
This is not a Scottish phenomenon. For the UK has a whole, nominal GVA per head in 2018 was £28,750. However, without the contribution of the four capitals (London, Edinburgh, Cardiff and Belfast), this falls to £25,050.
The fact that these large location-based discrepancies exist sheds light on the most important caveat to consider when using GDP figures to argue how well-off a country is:
GDP does not tell the full story about the distribution of a country’s wealth, or the wellbeing of its individuals.
Alternative measures of wealth: GNI, GDHI, wellbeing
GNI
Recall that GDP measures all economic activity within a country’s borders. But that doesn’t mean that the money earned through this activity remains within the same country. Foreign workers may send some of their income back to their families abroad. Perhaps more significantly, foreign-owned companies are likely to move their profits earned from operations in Scotland abroad.
To account for the fact that the monetary benefit of economic activity in a country isn’t necessarily kept within that country, economists use a measure called Gross National Income (GNI). Rather than measuring what is produced inside a country’s borders, it measures all income made by a country’s citizens and firms – domestically and abroad.
The most recent GNI data available from the Scottish government is for 2017. Looking back over a period of 20 years, the GNI-GDP relationship shows a consistent trend.
Chart 12: Scottish nominal GDP (including geographical share of extra-regio) and GNI, 1998-2017
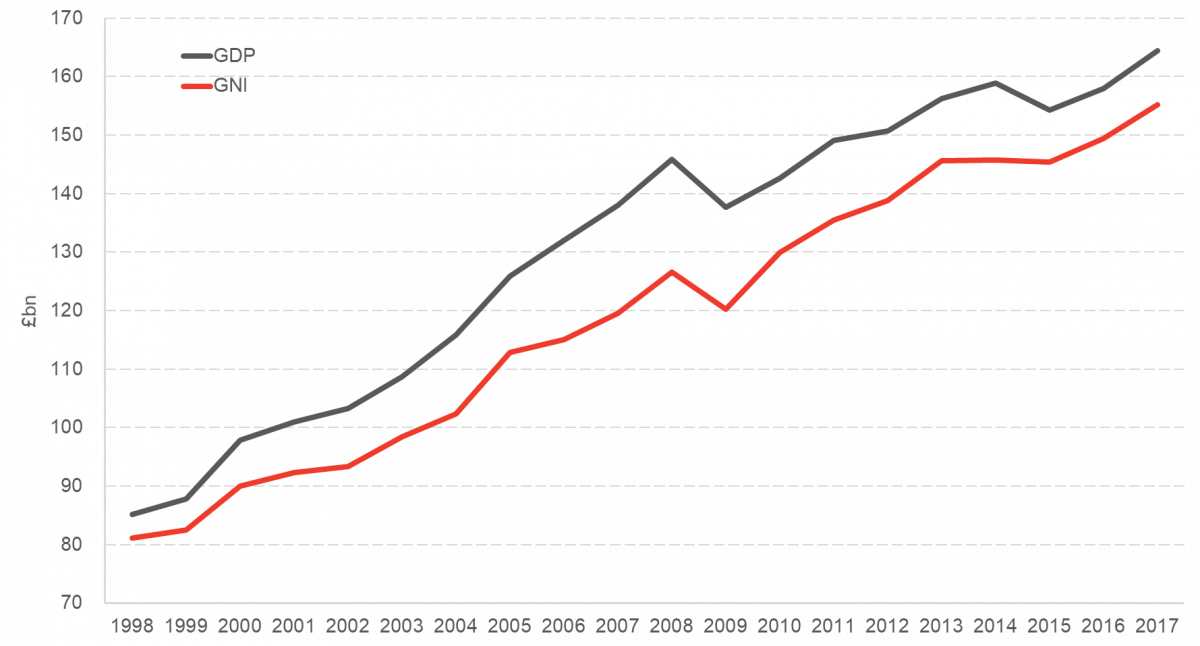
Sources: QNAS Q1 2020; Scottish Government
Scottish GNI has consistently been slightly lower than Scottish GDP. In practice, this means that more money has been sent out of Scotland from foreign workers and firms than money that has been sent back to Scotland from Scottish workers and firms abroad. On a per-head basis, Scottish GNI in 2017 was £28,600.
GDHI
It is important to note that a GNI of £28,600 doesn’t mean the average Scot has £28,600 to spend throughout the year. Scotland, as many other countries, operates a welfare state which relies on income redistribution (i.e. taxes, social contributions, and benefits). Gross Disposable Household Income (GDHI) measures how much money households have available to spend once these income redistribution measures have been accounted for.
Chart 13: GDHI per head, UK & 4 nations, 1997-2018
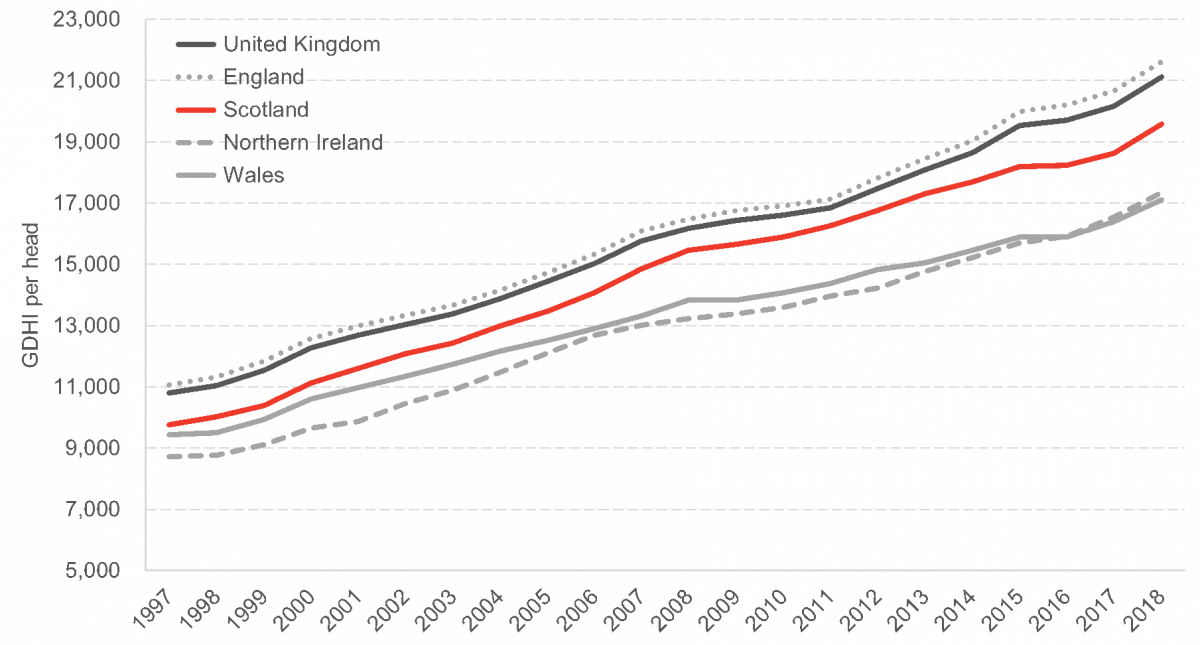
Source: ONS(c)
At £19,550 in 2018, Scottish GDHI per head is lower than GNI and GDP per head. However, this is generally true for the UK as a whole and each of its four nations. Interestingly, when comparing the above chart with Chart 6, the rankings haven’t changed: Just as with GDP per head, Scottish GDHI per head is slightly lower than England’s and that of the UK as a whole, but higher than Northern Ireland’s and Wales’. However, the regional disparity isn’t as pronounced for GDHI per head.
Chart 14: GDHI per head, Scotland, 2018
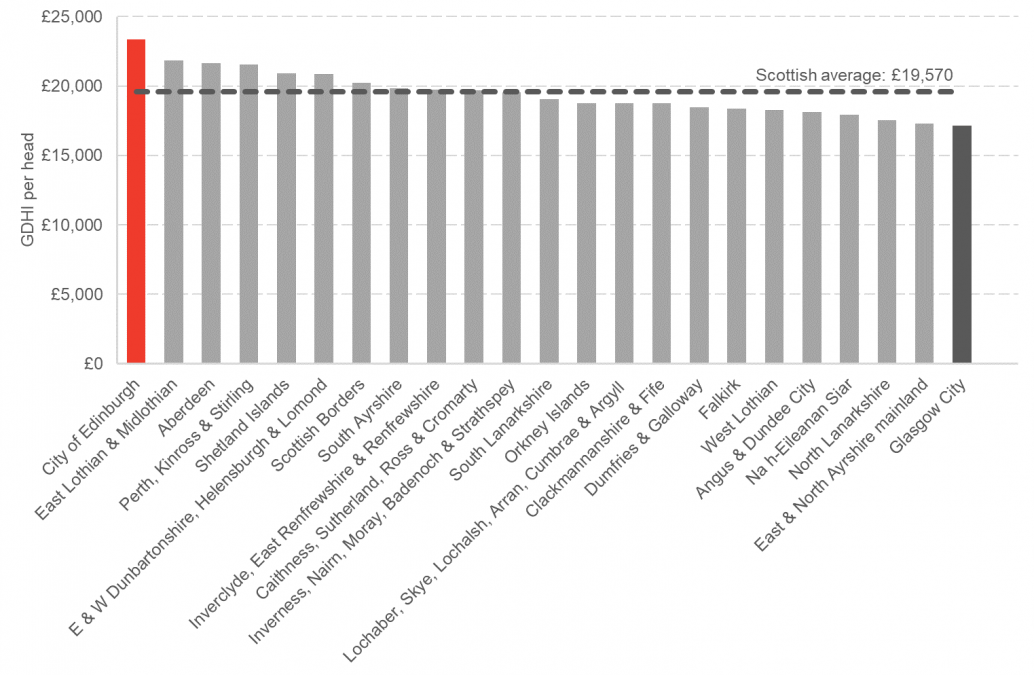
Source: ONS(c)
The fact that the difference between the region with the highest GDHI per head (Edinburgh: £23,350) and the lowest (Glasgow: £17,150) is just over £6,000 means that Scottish GDHI per head is a relatively accurate representation of the money available to households across Scotland.
Wellbeing
No matter which measure is used – GDP, GNI, or GDHI – they all primarily tell us something about a country’s financial or material wealth. In recent times however, more focus has been placed on looking at the broader picture of people’s wellbeing. Scotland’s First Minister Nicola Sturgeon advocated this in a Ted talk last year, and you can read about several ways of measuring wellbeing in our article about it.
The most prominent of such measures is the United Nations’ Human Development Index (HDI), which includes indicators for education, health and economic achievement. Others have argued for a new measure of GDP to include the cost of the environmental damage incurred due to a country’s economic activity – this is called ‘green GDP’.
Table 1: HDI indicators
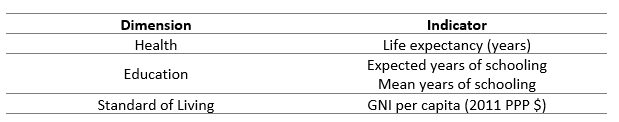
Source: Human Development Index (HDI)
Comparing HDI values, a familiar pattern emerges: Scotland’s HDI is slightly lower than the UK’s, but higher than Northern Ireland’s and Wales’ (an individual HDI value for England isn’t available). Countries with an HDI above 0.8 are considered as those with ‘very high human development’. In 2018, Scotland’s HDI was just over 0.9, the same as Austria.
Chart 16: Human Development Index (HDI), 1990 – 2018
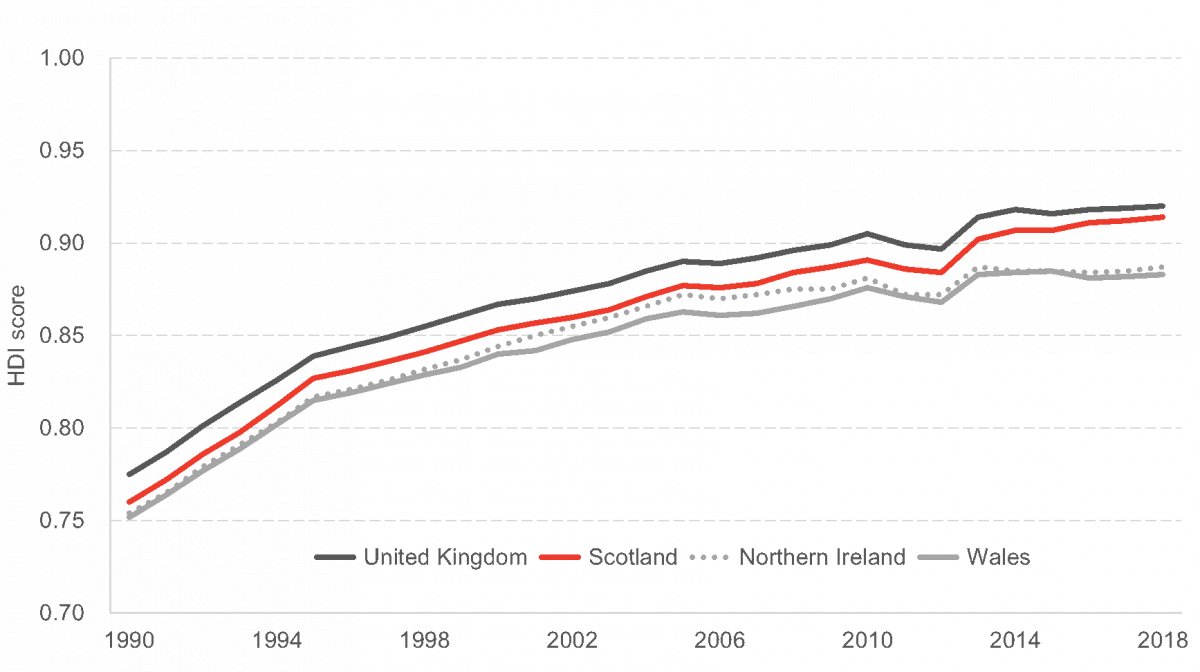
Notes: data for England was not available
Source: globaldatalab.org
Another international comparator is the OECD’s Better Life Index. It compares countries in eleven areas: housing, income, jobs, community, education, environment, civic engagement, health, life satisfaction, safety, and work-life balance. Among the countries compared, most of them developed countries, the UK scores above average in all but work-life balance and housing.
The OECD also looks at regional well-being, where instead of work-life balance a region’s access to services is measured. Scotland is in the top 5 (of 12) regions in the UK in all measures except for housing, safety, and health. Significantly, Scotland ranks highest among UK regions in three areas: civic engagement, community, and life satisfaction.
The ONS also publishes a dashboard of 43 indicators for national well-being, covering areas from personal (emotional) wellbeing and health to the environment and economy.
Similarly, the Scottish government last published a report on Scotland’s wellbeing in May 2019, which considers 81 indicators for the achievement of 11 national outcomes.
Such measures undoubtedly are important for a wider understanding of how well-off a country and its population are. However, recently there have been suggestions that measures of national wellbeing completely replace GDP. These suggestions are perhaps based on a false perception of what GDP is supposed to tell us.
GDP primarily measures the size of economic activity in a geographic area. It can tell us the value of goods and services produced in an economy, and compare this across economies and over time. It can also tell us something about the drop in economic activity during lockdowns or other restrictions on movement and business operations.
GDP will not give us a comprehensive overview of how a country and its people are faring in numerous aspects of modern life, and neither is it supposed to. But few would dispute that it is important to measure the size of an economy, along with various other measures of wellbeing.
These measures aren’t perfectly interchangeable, rather they complement each other. For more discussion on GDP and wellbeing, see our two articles here and here.
Perhaps most importantly, no matter which of the measures presented in this guide are used, Scotland fares well within the UK and internationally.
[1] Generally, international GDP figures are converted to USD. For better comparison with the Scottish figures used in this guide, we converted from USD to GBP by using the mid exchange rate for 2019 from Pound Sterling Live.