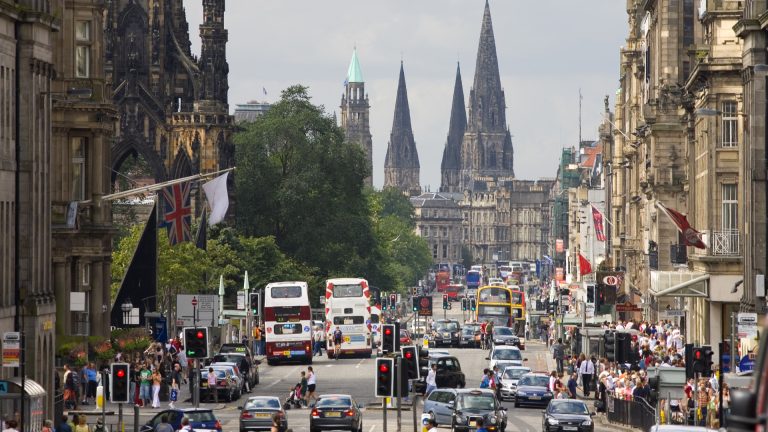
2021 was an incredibly challenging year for tourism in Scotland, which has been dominated by COVID-19.
The year started with the country in a national lockdown, with public health restrictions gradually easing over the first half of the year in line with reduced case numbers and deaths, and continued with the widespread roll out of the Vaccination programme, before ending with the spread of the Omicron variant.
Some restrictions – most notably on international travel – have remained over the year, and through the year the tourism industry has been one of the most badly affected sectors.
This short blog uses regularly updated country-level indicators on firms, transport and travel and economic activity, to show what can be observed from the industry-level data about tourism’s trajectory through 2020 and 2021..
In the fast-changing policy climate and with the diffusion of the Omicron variant, the landscape is quickly evolving. Such indicators offer a chance to understand how behaviour has evolved over 2021 and the consequences for particular sectors in advance of later data, such as quarterly GDP or employment figures.
Data have helped hugely in communicating public health messaging through the pandemic and economic data has evolved to keep pace with the demands of policymakers in making real-time decisions.
Full details of the indicators used, including their sources, are given at the end of this blog.
Firm performance measures
One group of indicators relates to businesses categorised by the industrial activity they undertake. The Business Insights and Conditions Survey (BICS), previously named the Business Impacts of Coronavirus, provides regularly updated questions on business performance metrics. Scottish Government produced weighted estimates, which provide a more representative picture than the upweighted values for Scotland provided in the ONS returns for the UK as a whole.
The sample covers all businesses in Scotland with more than ten employees, and most sectors of the economy (excluding Agriculture and Public sector).
We chart the response to three questions from this survey: the % of businesses currently trading (Figure 1); the % of businesses reporting turnover lower than expectations for the time of year (Figure 2); and the risk of insolvency (Figure 3a and Figure 3b).
For each we can provide figures for “All businesses” alongside “Section I” – defined as Accommodation and Food services. This is the sector most heavily impacted by tourism spending, as it includes overnight accommodation, e.g. hotels and B&Bs, and also tourist-facing sectors, such as Restaurants and Bars.
Figure 1 shows how the percentage of businesses currently trading has evolved over the period since Wave 7 to Wave 45. Each wave of the survey represents for a non-overlapping two-week period, and so chart corresponds to dates between June 2020 to December 2021.
Early 2021 – i.e. Waves 21 to 27 – correspond to the period of the second national lockdown. During this period, we can see that in that while more than 80% of all businesses were trading, fewer than two in five Accommodation and Food Services firms were active.
Figure 1: % of businesses currently trading, Wave 7 to Wave 45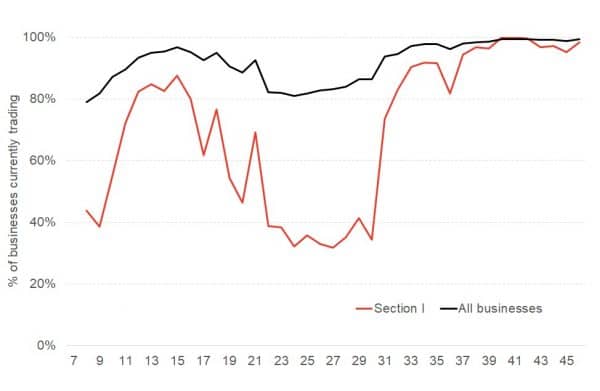
Source: Scottish Government
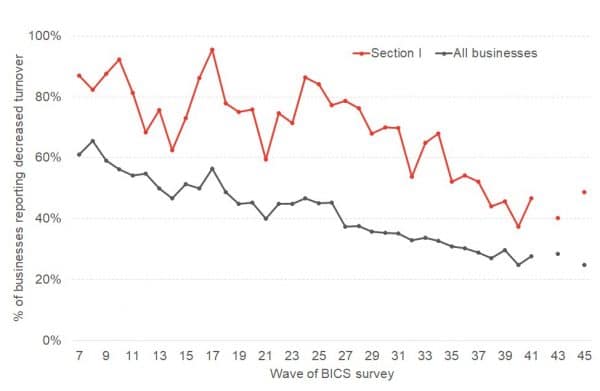
Figure 2 shows us how many trading firms were seeing turnover that was lower than expectations for the time of year. Again, we see that Accommodation and food services firms were more significantly impacted, peaking with 86% in Wave 24 (8-21 February 2021). We see that this has reduced steadily through 2021 for both Section I firms and All businesses The most recent data suggesting a renewed divergence between these series with a rise in Section I businesses reported decreased turnover.
Figure 2: % of businesses reporting decreased turnover, Wave 7 to wave 45
Source: Scottish Government
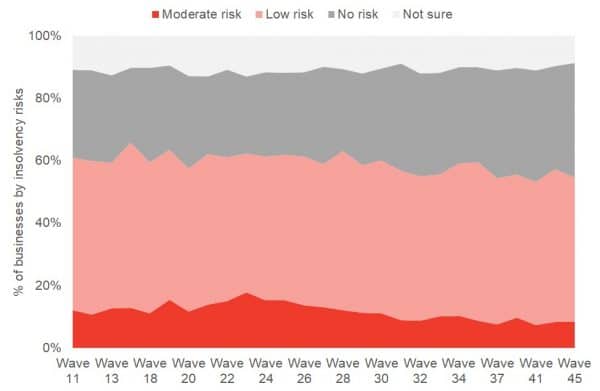
Figures 3a and 3b show the insolvency risk of businesses in each wave (this question was asked for a slightly smaller period, starting in Wave 11).
Figure 3a shows that for All businesses we can broadly identify two period. One before Wave 26 had roughly constant risks across all categories, while from that point onwards, a steady decline in the respondents noting “moderate” or “severe” risk of insolvency. The final Wave in the sample covered notes 81.3% of All businesses in “no risk” or “low risk” categories.
Figure 3a: % of All businesses currently trading by insolvency risk, Wave 11 to 45
Source: Scottish Government
Figure 3b on the other hand, shows the same insolvency risks isolating only those firms in Section I. We firstly see a much greater volatility in responses, however this is likely driven by the smaller sample size compared to All businesses.
We can however note a much higher perception of insolvency throughout the period of the data –the share of businesses at “severe” or “moderate” risk peaked at 41.2% in Wave 23, when the risk for All businesses was 17.8%.
The risk of insolvency for firms in Section I has continued to decline through 2021, however in Wave 45, 72.8% of those businesses perceive either “no risk” or “low risk” categories, lower than for All businesses as a whole (82.5%).
Figure 3b: % of Section I businesses currently trading by insolvency risk, Wave 11 to 45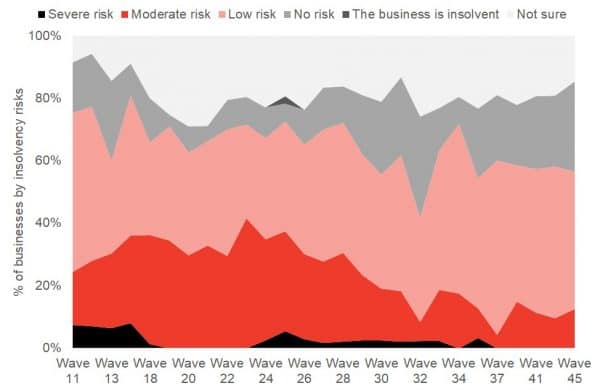
Source: Scottish Government
Measures of transport and travel
An additional set of indicators relate to the decisions of households, including around purchases and travel.
Figure 4 shows the volume of transactions in Pret A Manger stores across the UK, grouped by the areas for which the data is published by ONS.
January 2020 is used as the pre-pandemic baseline, so that values show the extent to which transactions have recovered to their previous levels.
These data are only provided for the period since March 2021, and the end of the second national lockdown.
Figure 4 show that for Scotland these increased consistently through 2021 however since the start of December this index has fallen sharply in line with revised guidance to work at home where possible in response to the Omicron variant.
Figure 4: Transactions in stores, index: 100 = January 2020 average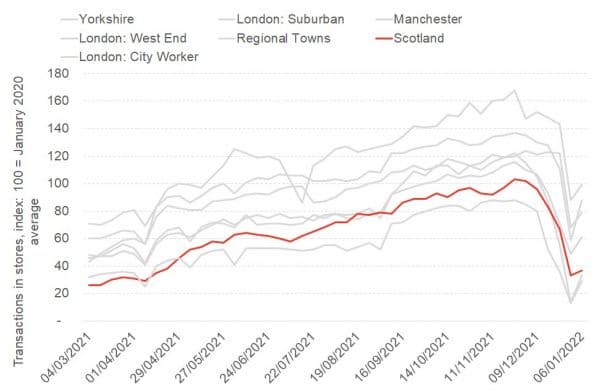
Source: ONS
Figure 5 shows the number of passengers flying to or from Scottish airports by month. As a measure of passenger numbers at airports, this series is well-placed to offer insight into the changing volume of travel into and from Scotland over the period of the pandemic.
We plot the number of terminal passengers, defined as passengers who join or leave an aircraft at the airport, for EU and Other international passengers and so who are not travelling to or from other UK airports.
The data is available over a long time period, however we plot only the monthly passenger numbers for January 2019 until November 2021 (the latest data available).
We can clearly see the pre-pandemic year of 2019 and the hit to travel numbers in both 2020 and 2021. Passenger numbers in January and February 2020 are even slightly higher than the same months in 2019, but fall sharply with the introduction of international travel restrictions from March 2020.
Over the year, passenger numbers totalled 12.9 million in 2019, and only 2.8 million in 2020 – and half of that total came in the first two months.
International passenger numbers in 2021 were broadly similar to those seen in 2020 from April until August. While monthly passenger numbers for September, October and November are slightly higher than in 2020, they remain well below pre-pandemic levels.
Figure 5: Monthly EU and other international terminal passenger traffic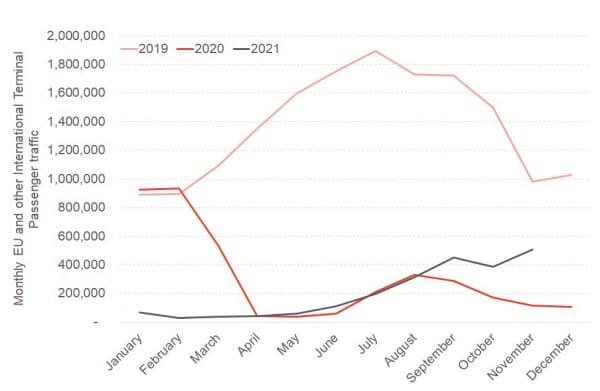
Source: Civil Aviation Authority and authors calculations.
Figure 6 shows sales of road fuel (i.e. petrol and diesel) at surveyed service stations and provides a series from the start of 2020.
We have transformed this series slightly to construct a rolling monthly average – which flattens out any spikes, such as around the fuel crisis in September – and show this relative to the pre-pandemic average (taken as the month prior to the introduction of the first lockdown in March 2020).
We see the very rapid reduction in road fuel sales in March and April 2020, down to below 40% of their pre-pandemic values, before a recovery to Autumn 2020.
The national lockdown in January 2021 saw a smaller fall in fuel sales than in the Spring 2020 lockdown, which was again consistent across each of Scotland, England and Wales.
We again note that this index had not recovered to its pre-pandemic levels until (very briefly) September 2021, and fell sharply in the last few weeks and now lies around 30% below the values seen at the start of 2020.
Figure 6: Average daily road fuel sales, rolling monthly average sales volume compared to mid-February-Mid-March 2020 average, Scotland, England and Wales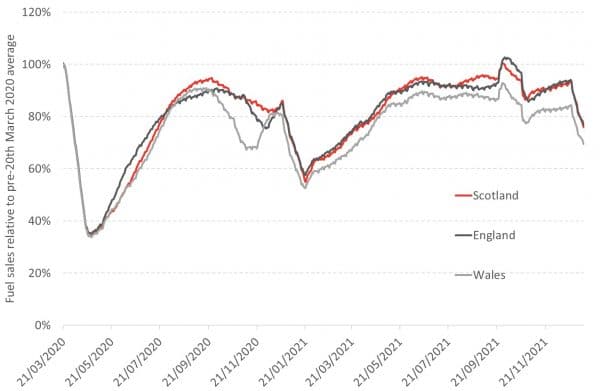
Source: BEIS and authors calculations.
Figure 7 looks at the use of transport, and uses figures for Great Britain as a whole. Each day is shown as the equivalent to the day in previous years, so that figures above 100% mean that transport use by that mode is in excess of previous values for that day.
The series for car use (shown in light grey) supports the same narrative as that shown in Figure 6, with a sharp reduction in 2020, and a smaller fall at the start of 2021. We do not see the same unusual pattern in the recent period, suggesting that car use remains below previous levels and that the fuel sales series continues to be distorted by the fuel crises.
The sharp reduction for National Rail (red) and bus travel (black) shows that public transport use has been more impacted than use of private vehicles, with current use around 60% and 80% of equivalent usage respectively. This will also likely be a consequence of continued working from home for many.
Figure 7: Transport use as % of equivalent day by mode of travel![]()
Source: Department for Transport
Economic performance measures
Our final indicator is Gross Domestic Product (GDP) which is the total value added in production.
The Scottish Government’s series on monthly GDP identifies the change in monthly GDP relative to its pre-pandemic levels of February 2020.
Figure 8 shows how this has evolved over the period to October 2021. The first lockdown is clearly evident, with its devastating impact on Accommodation and food services, where GDP fell by 84.2% relative to pre-pandemic levels, before then recovering through the summer of 2020 before declining to the end of 2020. The lockdown at the start of 2021 saw this continue to decline, before easing back towards its pre-pandemic levels by the end of the series.
While GDP for the Scottish economy as a whole remains 1.1% below its February 2020 value, the Accommodation and food services sector is 8.1% lower, reflecting its greater exposure to the tourism restrictions.
Figure 8: Cumulative change in Gross Domestic Project by broad sector relative to February 2020, Scotland, March 2020 to October 2021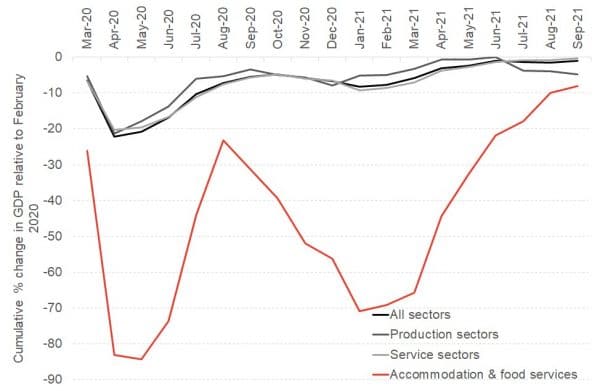
Source: Scottish Government
Table of data and sources
| Variable | Published by | Updated | Weblink | |
| 1 | % of businesses reporting decreased turnover |
Scottish Government | Fortnightly | Go to Data |
| 2 | % of businesses currently trading | Scottish Government | Fortnightly | Go to Data |
| 3 | % of businesses currently trading by insolvency risk |
Scottish Government | Fortnightly | Go to Data |
| 4 | Transaction in stores, index: 100= January 2020 average |
Office for National Statistics |
Weekly | Go to Data |
| 5 | Monthly EU and other International Terminal Passenger Traffic |
Civil Aviation Authority | Monthly | Go to Data |
| 6 | Average road fuel sales and stock level |
Department for Business Energy and Industrial Strategy |
Weekly | Go to Data |
| 7 | Transport use as % of equivalent day by mode |
Department for Transport | Weekly | Go to Data |
| 8 | Cumulative % change in GDP relative to February 2020 |
Scottish Government | Monthly | Go to Data |
Authors

Grant Allan is a Reader in the Department of Economics. Grant's research interests in applied multisectoral economic analysis and modelling, particularly in the areas of environment, energy and tourism.

Gioele is a Senior Lecturer in the Department of Economics, University of Strathclyde.