
After the recovery in most economic indicators throughout the summer months following the easing of some restrictions, the latest data shows that volumes of new business started slowing down in September. With further restrictions brought in by the Scottish Government at the start of October, mobility of the Scottish population is starting to fall again. The Scottish Government is to set out further COVID-19 restrictions in the form of a five-tier system later today that will come into force from 2nd November.
The Scottish housing market has started recovering from the lows of the lockdown but remains volatile and with a large degree of differences in house price growth across Scottish local authorities.
The number of claimants has fallen in September across most of Scotland, but some local authorities are seeing a further deterioration in their labour market. Furthermore, the fall in working hours that we discussed in our labour market update last week has also been unevenly shared across regions.
This week Scottish GDP data for August was published highlighting disappointing growth of just 2.6% between July and August – similar to the UK over the same period (2.1%). The Scottish economy remains 9.4% below pre-crisis levels in February.
In addition to the COVID-19 pandemic and ongoing economic crisis, the form of the UK’s future trading relationship with the EU remains uncertain. At the start of this week, we published an opinion article on Brexit and the difficult path ahead.
Chart 1: Effect of Covid-19 on business operating costs and turnover, UK nations, 21st September – 4th October: Around a fifth of Scottish businesses reported having operating costs equal to or more than their turnover. Of the four UK nations, Scotland had the smallest share of businesses reporting that they were breaking even or had costs exceeding turnover. But, just a third of businesses in Scotland reported having turnover greater than operating costs.
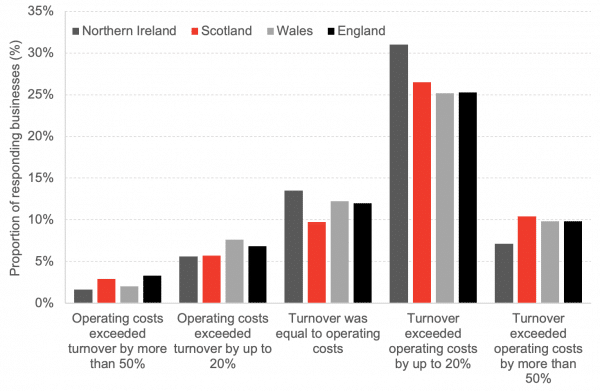
Source: ONS BICS
Chart 2: Composite PMI index, Scotland, January 2019 – September 2020: backlogs of work and employment amongst Scottish businesses continued to decline in September. Volumes of new business declined in September after experiencing some growth in August. Output, expectations of future output, and prices all grew in September, but the pace of growth was slower compared to August.
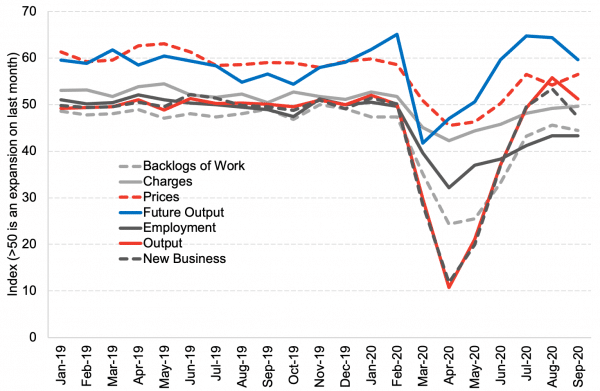
Source: IHS Markit
Chart 3: Mobility to different venues, Scottish cities, 21st February – 13th October: the Scottish Government announced new restrictions on the 7th October. In the first week after the measures were announced mobility to retail and recreational venues, transit stations, and workplaces started falling again after a fairly consistent recovery experienced over the past couple of months.
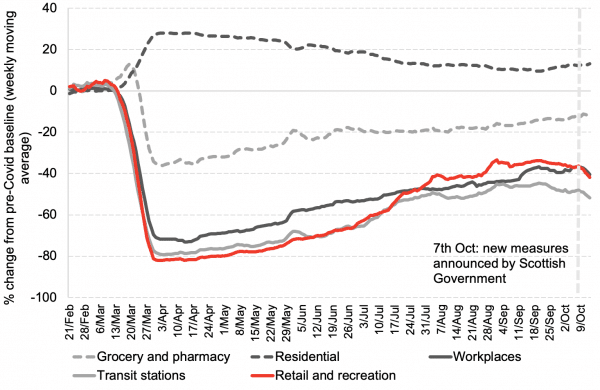
Source: Google Covid Mobility Trends
Note: The reported values are an average for Scotland’s largest cities (Edinburgh, Glasgow, Aberdeen)
Chart 4: Number of advance notices and volume of residential property sales, Scotland, week ending 4th January 2019 – 25th September 2020: The property market has been an extremely interesting one to watch over the past few months. The market recovered unexpectedly fast once restrictions were eased in Summer however, the volume of transactions slowed again in the first week of September. Advance notices (a leading indicator for the volume of property transactions) grew by just under 20%, on a week-to-week basis, in the week ending 25th September, suggesting that a slight recovery in property sales may have occurred during the second half of September.
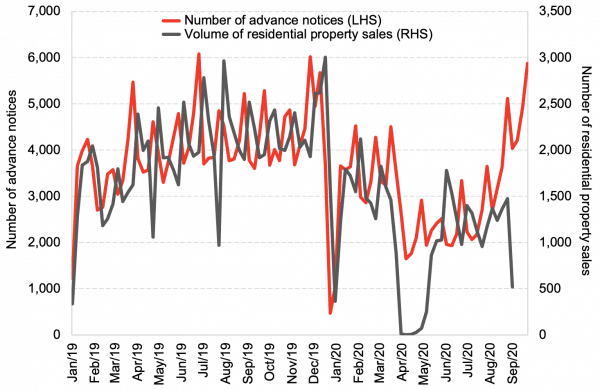
Source: Registers of Scotland
Chart 5: Average house price growth, Scottish local authorities, August 2019 – August 2020: Average house prices in Scotland grew by 0.7% in the year to August 2020. However, growth has been varied. East Dunbartonshire, Aberdeenshire, and East Ayrshire saw average house prices fall by close to 15%. On the other hand, West Dunbartonshire, Orkney Islands, and East Lothian saw house prices grow by a similar magnitude.
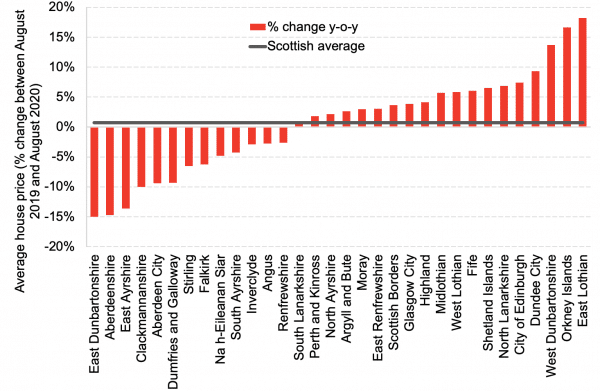
Source: Registers of Scotland
Chart 6: Claimant Count, Scottish local authorities, August and September 2020: Claimant Count (number of people on Universal Credit and Jobseekers Allowance) in Scotland fell by 1.3% between August and September. The degree of recovery has varied amongst Scottish local authorities. Despite a recovery experienced across most of Scotland, Shetland Islands, Aberdeen City, Aberdeenshire, Angus, and Dundee saw the number of claimants rise.
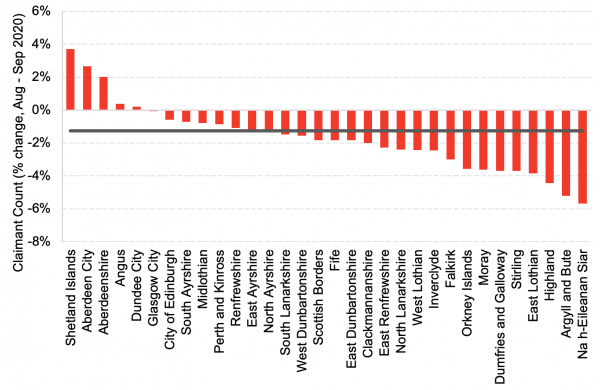
Source: ONS NOMIS
Chart 7: Change in usual working hours between year to June 2019 and year to June 2020, Scottish local authorities: Across most Scottish local authorities, the fall in working hours due to Covid-19 was most pronounced amongst those who previously worked 45+ hours per week. A large share of these workers transitioned into working 35-44 hours a week. The decline in usual working hours was more pronounced in some local authorities. For example, in Fife and Orkney Islands there was a sharp decline in the number of people working 35 to 44 hours and 45+ hours per week.
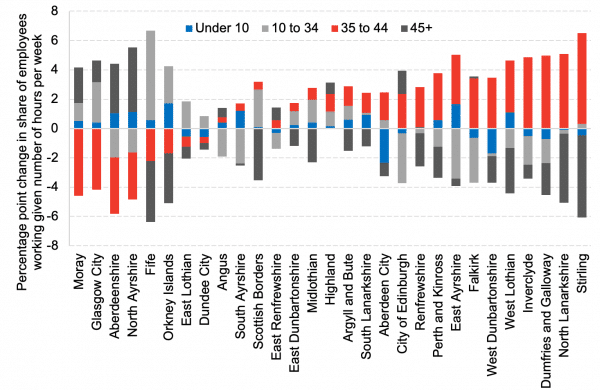
Source: ONS NOMIS / APS
Note: The confidence intervals around estimates in APS in the ‘under 10 hours’ category are large for some local authorities. The data should thus be interpreted with caution and with a focus on overall trends rather than precise point-based estimates. Furthermore, people on furlough would not experience a change in their usual working hours but only in actual working hours. The effects of furlough are thus not reflected in the above data.
Chart 8: Proportions who answered extremely/very concerned about each statement, Scotland, August 25-26: When looking ahead one month, 14% of respondents were extremely concerned about not having a job, with around 12% reporting high levels of concern around being able to pay bills. This fiscal insecurity translated into 13% of respondents expressing high concern around providing for their household. The same YouGov survey also found that approximately 22% of respondents felt their job was at high risk from coronavirus.
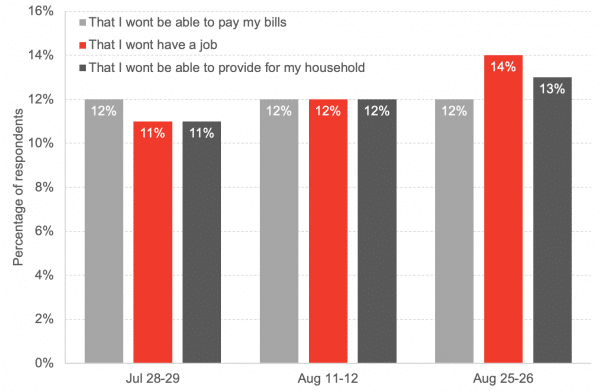
Source: Scottish Government
Note on our real-term indicators analysis:
We review newly available data each fortnight and provide a regularly updated snapshot of indicators that can provide information on how the economy and household finances are changing. This allows us to monitor changes in advance of official data on the economy being released and also to capture key trends that will be missed by measures such as GDP. Each fortnight we investigate new sources from known data sources and use publicly available data.
Authors
The Fraser of Allander Institute (FAI) is a leading economy research institute based in the Department of Economics at the University of Strathclyde, Glasgow.