Household income is a key determinant of a household’s standard of living. Government policies can have a range of direct and indirect impacts on the amount of money households have to spend on goods and services. Hence, it becomes a big deal at election time, with lots of debate about winners and losers and who should and shouldn’t benefit.
Whilst some like to present a dichotomy between those who are net contributors to the public purse through taxation and those who are net beneficiaries from social security and use of public services, the reality is more complex, and most of us are likely to be both contributors and beneficiaries at various different points in our lives.
Changes in income due to government policy can be very noticeable, and have a significant impact on current household finances. Any proposed changes therefore garner a lot of interest.
Direct taxation and transfers are relatively easy to implement and the (direct) impact on household incomes largely predictable. More indirect policies, that seek to reduce barriers to paid employment for example, are less simple. There may be multiple barriers to overcome and for some people work just isn’t a viable option, for example due to ill health. Ensuring that everyone has the means to meet their basic needs is generally agreed as the “right thing to do”, although the parties may have different views on the best way to achieve that.
This briefing provides a guide to household incomes in Scotland to help navigate the debate.
What is household income?
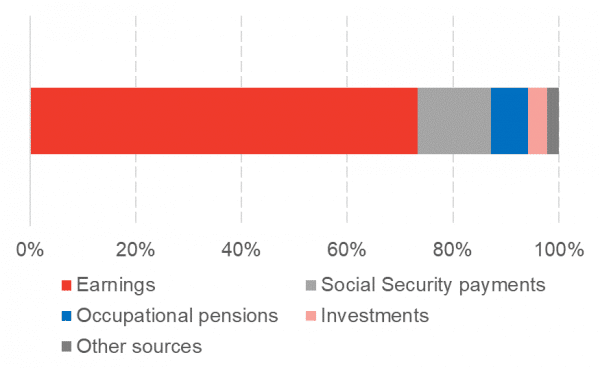
There are two main components of income:
- Earnings from employment, including self-employment
- Social security payments such as state pension, universal credit and child benefit.
Occupational pensions, investment income and other sources such as student loans or child maintenance make up the residual.
Chart 1: Components of average income (2017 – 2020)
Source: Scottish Government/Households Below Average Income dataset (DWP)
Income is net of income tax payments, national insurance contributions, pension scheme contributions, council tax and child maintenance payments.
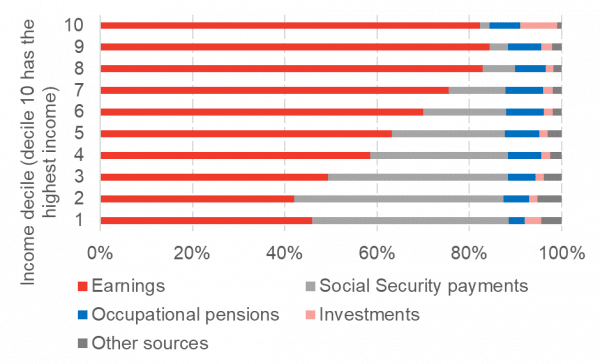
Chart 2: Components of income by decile (2017 – 2020)
Source: Scottish Government/Households Below Average Income dataset (DWP)
The income distribution ranks households in Scotland by income and is used to show the differences in household income through Scotland.
Many social security payments are means tested, meaning they become available when earnings fall below a certain level. This is why social security payments make up a higher proportion of income at the lower end of the income distribution. However, social security also provides financial support to people on higher incomes through pensions and near-universal benefits such as child benefit.
Comparing households equally across Scotland
Incomes are adjusted to take account of the size of the household so that their livings standards can be compared on a roughly comparable basis (called equivalisation).
Weightings are used for different household types in order to make the households comparable, as shown in Table 1 alongside the monetary amounts apply to these different household types.
Table 1: Annual income thresholds for net household income for different family types (before housing costs) (2017-20)
| Single Adult Household | Couple household | Single parent with 2 children (one over 14) | Couple with 2 children (one over 14) | |
| Weighting | 0.67 | 1 | 1.2 | 1.53 |
| Bottom 10% | < £9,000 | > £13,500 | < £16,200 | < £20,600 |
| Median | £18,600 | £27,700 | £33,300 | £42,400 |
| Top 10% | > £3,4200 | > £5,1100 | > £61,300 | > £78,100 |
Source: Scottish Government/Households Below Average Income dataset (DWP)
Incomes can also be measured on an after-housing cost basis, and this is often preferable as it gives more of an idea of disposable income available in the household. Housing costs are unavoidable, and they can vary substantially (by geography and by tenure) so by netting off this element, we can compare a little more clearly across households.
Devolved policies that impact on income
This is a summary of some of the main policy levers the Scottish government has under their control in the current devolution settlement.
Recurring taxation aimed at individuals and households
- Scottish Income Tax
- Council Tax (along with power to replace it with a different local tax)
Scottish social security
- Disability and carer benefits
- Means tested-benefits and reductions (Scottish Child Payment and Council Tax Reduction are current examples)
- Benefits in kind (e.g. free school meals)
Earnings
- Employability programmes (e.g. Fair Start Scotland)
- Public sector-pay and conditions
- Using procurement as a tool to support fair work
- Encouraging business participation in fair work practices
- Providing services that facilitates paid work (e.g. childcare, transport, social care support)
- Skills and training and education
Housing Costs (if looking at after housing cost measure of income)
- Powers over rents
- Housing supply
- Indirect impact on social housing rents via levels of grant and responsibilities placed on social housing providers
This list does not include non-housing policies that reduce costs but represent the ‘social contract’, for example, free prescriptions and free undergraduate university education, or free bus travel for over 65s. Not all individuals access these services, and they are not provided on the basis of income (i.e. they are not means tested). Although they do not relate to income, they can make a significant difference to the amount of residual income that a household has to spend on other things, and hence can have an impact on standard of living.
Key statistics
Average Income
The most recent official data on household income relates to the financial year 2019/20. This data is collected from a UK wide survey called the Family Resources Survey. The relatively small size of the sample in Scotland means that often three years worth of data is averaged together to give more certainty to the estimates.
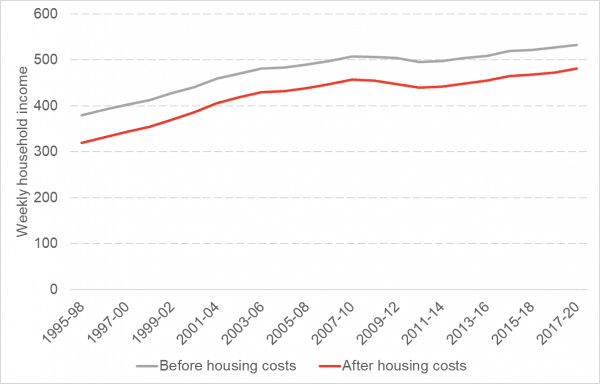
In the three-year period 2017-20, median income in Scotland was £533 per week before housing costs and £481 after housing costs had been taken into account. Incomes (in real terms) according to the most recent data have risen since the last election (note all official figures are pre-covid).
Chart 3: Median income over time (2019/20 prices)
Source: Scottish Government/Households Below Average Income dataset (DWP)
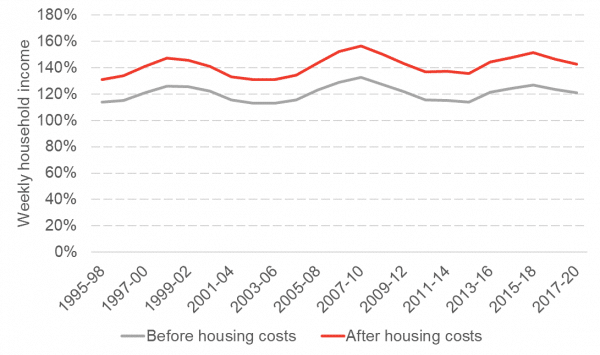
However, real terms growth in income has been remarkably sluggish in recent years compared to historical trends. Chart 4 shows real terms growth in before housing costs real terms income.
Chart 4: Real terms changes in median income
Source: Scottish Government/Households Below Average Income dataset (DWP)
Income Inequality
Income inequality shows the extent to which income is unequally shared across the population. Income inequality is due to a range of factors. Whilst some parties may have different views on the extent to which this inequality, particularly where it is due to high earning individuals, is an issue most agree that more needs to be done to tackle low incomes and barriers that prevent social mobility.
Understanding the income distribution is important for designing policies such as tax and benefit policies, and it is also important for understanding the drivers of issues such as the attainment gap and health inequalities. Some studies point to inequality itself as a driver of many societal problems, with more unequal societies performing worse on many other outcomes.
There are various different figures that are used to describe income inequality. Two of the most frequently used in Scotland are the Gini coefficient and the Palma ratio. The Palma Ratio shows how the incomes of the top 10% of the population compare to the bottom 40%. In 2017 – 20, the top 10% had 43% more income than the bottom 40% combined on the after housing cost measure. There is no trend apparent in the data over the past 20 years although over the past few years has declined marginally (this data does not include the period of the Covid-19 pandemic).
Chart 5: Palma ratio
Source: Scottish Government/Households Below Average Income dataset (DWP)
Low income/poverty
Those at the lowest end of the income distribution are those least likely to be able to meet their basic needs. A number of definitions of poverty try to capture this, as it can be difficult to measure such a multi-faceted issue with a single statistic. There are four measures that the Scottish Government tends to use: relative poverty (a measures of low income compared to a population average); absolute poverty (a measure of how low income has changed over time); material deprivation (a measure of whether essential goods and services can be afforded) and; persistent poverty (a measure of how many years a person has been living in poverty).
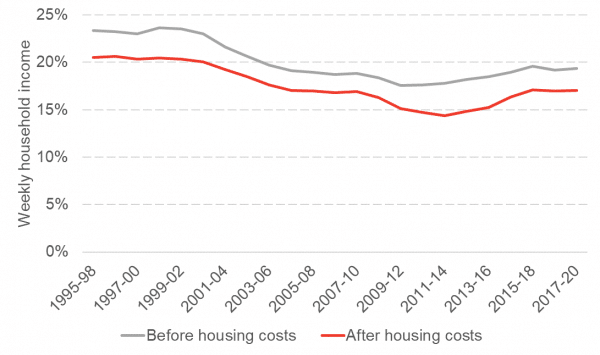
Most measures, although at varying levels, have demonstrated a similar trend over recent years (pre-covid) when measured at the population level, and in the last five years have been fairly stable.
Chat 6: Relative Poverty – whole population
Source: Scottish Government/Households Below Average Income dataset (DWP)
However, there are some different trends lying beneath the headline statistics. For example, in-work poverty has risen significantly since the last recession (52% AHC at its lowest in 2009 – 12 compared to 61% AHC in the latest data) , although this has now stabilised. Pensioner poverty had been on a steep downward trend since the 1990s, but in recent years has started to increase slightly although this is now levelling off.
Poverty rates are much higher for people living in households were a person is disabled (23% AHC compared to 19% AHC for the population average), for children (24%) and it is also higher for those in ethnic minority groups (41% AHC for Asian or Asian British and 43% AHC for Mixed, Black or Black British and Other based on a sample of five years of data 2015 – 20).
The main policy routes for reducing relative poverty are via social security, policies which improve availability and access of good quality jobs, and reductions in the cost of housing (if using the after housing cost measure). Taxation is less effective as relatively few people living in poverty pay income tax, and many are protected from Council Tax by the Council Tax Reduction scheme.
There was consensus in the last parliament that saw the passing of the Child Poverty (Scotland) Bill in 2017, and generally finding ways to tackle poverty is seen as a responsibility of government. However, different parties have varying views on the right mix of policies to achieve this.
The Impact of Covid-19
There is little doubt that Covid-19 will have had an impact on average household incomes yet it will be 2022 before we get official statistics on household incomes covering the first year of the pandemic.
We know that the impact will not have been the same across all households. The pandemic will have led some people to lose their jobs and others to see reduced pay due to furlough. Others will have had no impact to their earnings and, due to working from home, may actually have seen a benefit to their bank balance from reduced travel costs.
There has been some data produced from the Understanding Society panel survey that helps us to track people over the course of the Covid-19. Analysis of this data for Scotland shows that by April 2020, there had been considerable changes in terms of hours worked compared to pre-pandemic.
Using a similar methodology to Benseval et al. with the sample limited to Scotland, we found that by April 2020, although employment had seemingly not reduced, the proportion of the population working positive hours had fallen from around 70% to around 50% (Benseval et al. found similar falls for the UK as a whole). The reduction was far larger for those educated to lower levels and we do see differences in different parts of the income distribution, with the impact most felt in Scotland in the second income quintile (as noted by Brewer & Handscomb here this is likely to be because there are more people in the lowest quintile who were not in work pre-pandemic).
The same patterns seen in April were still apparent in June, but by September 2020 (by which point many parts of the economy had reopened, albeit temporarily) there had been a bounce back in terms of hours worked, for some groups, but others had not recovered to previous levels. This was most likely to be the case for women, those in the 2nd and 3rd income quintiles. Interestingly, those with the lowest education levels, who were hit hardest earlier on, had almost fully recovered previous hours by September, which may imply it was lower skilled jobs (for example hospitality) that were seeing the biggest bounce back at this point.
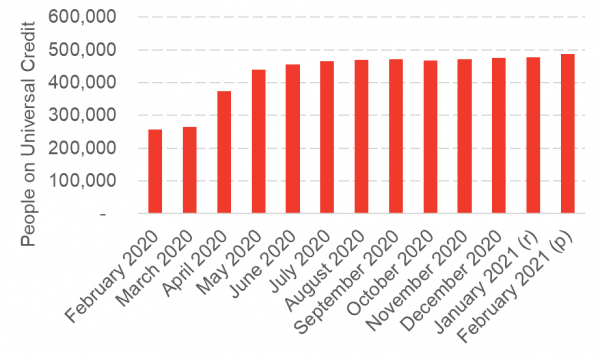
Of course, since September, there have been a number of subsequent lockdowns and the patterns may have reversed again. Universal Credit numbers rose sharply at the start of the pandemic and have stabilised since and may rise again significantly later in in 2021.
Chart 7: People on Universal Credit
Source: StatXplore (DWP)
What happens in 2021 is dependent on what happens to schemes such as the Coronavirus Job Retention Scheme (CJRS) and the Self Employment Support Scheme (SEISS). When support is removed as is currently planned at the end of September 2021, there may be many more people who find their jobs no longer exist and their incomes dropping substantially. The Universal Credit top up also ends at about the same time. See here for further discussion on the potential impact of this timing.
Conclusion
Even pre-pandemic, there was not a great deal to shout about with regards to household incomes. Growth since the last recession in average incomes has been sluggish, and poverty levels have not improved. The pandemic will have had a big impact, but much of the damage has been cushioned interventions such as the CJRS, SEISS and the UC uplift. Once these are taken away, the legacy of the pandemic on incomes will be clearer. For parties going into the election, the uncertainty that the next year will bring may make it hard to put forward effective policies, and indeed many of the powers used during the pandemic have been reserved and implemented by the UK Government.
However, there are already early signs that parties are keen to act using devolved powers, with many making pledges on increasing social security in Scotland for low income children. They may need to do much more than this once the scale of the impact of the pandemic becomes clear. Over the long term, sustainable improvements in income requires economic growth, distributed throughout the income distribution, and there are no shortage of challenges there either (see our economy election brief for more information).
Household incomes of course matter to voters, and government can play a key role in shaping how much and to who the income goes. We expect debates over the effect of policy on household incomes to feature widely in this election campaign despite the uncertainties of what will happen in the next year.
Authors
Emma Congreve is Principal Knowledge Exchange Fellow and Deputy Director at the Fraser of Allander Institute. Emma's work at the Institute is focussed on policy analysis, covering a wide range of areas of social and economic policy. Emma is an experienced economist and has previously held roles as a senior economist at the Joseph Rowntree Foundation and as an economic adviser within the Scottish Government.

Mark Mitchell
Mark Mitchell is a former research associate at the FAI. In 2021, Mark moved to a post in the Competition and Markets Authority. His research area is applied labour economics, focussing on the causes and effects of human capital accumulation over the lifecourse.
-768x432.jpg)
