On Tuesday we saw a glimpse of the impact of the initial shutdown on the labour market and claims to Universal Credit. Because of the nature of the shutdown, it is affecting some sectors more than others and indeed leading to increased demand in some.
Given the different industrial profile across Scotland, we would therefore expect this to translate into a differential impact across Scotland. Because of when data is released, and especially the lag in sub-regional UK being made available, we are seeing different numbers of people seeking financial support through Universal Credit in different parts of Scotland without being able to delve too far into exactly why. For example, we don’t yet have official data that can tell us what happened to different sectors in Scottish local authorities in at the start of the lockdown.
However, understanding what is happening across Scotland as soon as possible is important as it may give important insight into where particular support needs are, hence these figures are worthy of analysis even if the data can’t be fully explained . This article looks at the changes in the number of people on in Scottish Local Authorities on Universal Credit between March and April 2020 using data released by the DWP.
DWP data on Universal Credit (UC) is incredibly useful, not least because it is based on administrative data rather than a sample survey. For sub-national areas, for example local authorities, it therefore is far more reliable than a lot of other sources of data we see.
Note that the data in this article only captures UC claimants – there will be some existing caseload on Job Seekers Allowance, Employment and Support Allowance and Tax Credits that are yet to transition to Universal Credit that aren’t included here. As applications to these schemes has ceased, these figures will not have increased last month, but there may be some leaving these legacy benefits to join UC, for example, if their circumstances have changed significantly. In addition, it’s important to remember that not all UC claimants are out of work – some will be receiving top-ups to low earnings.
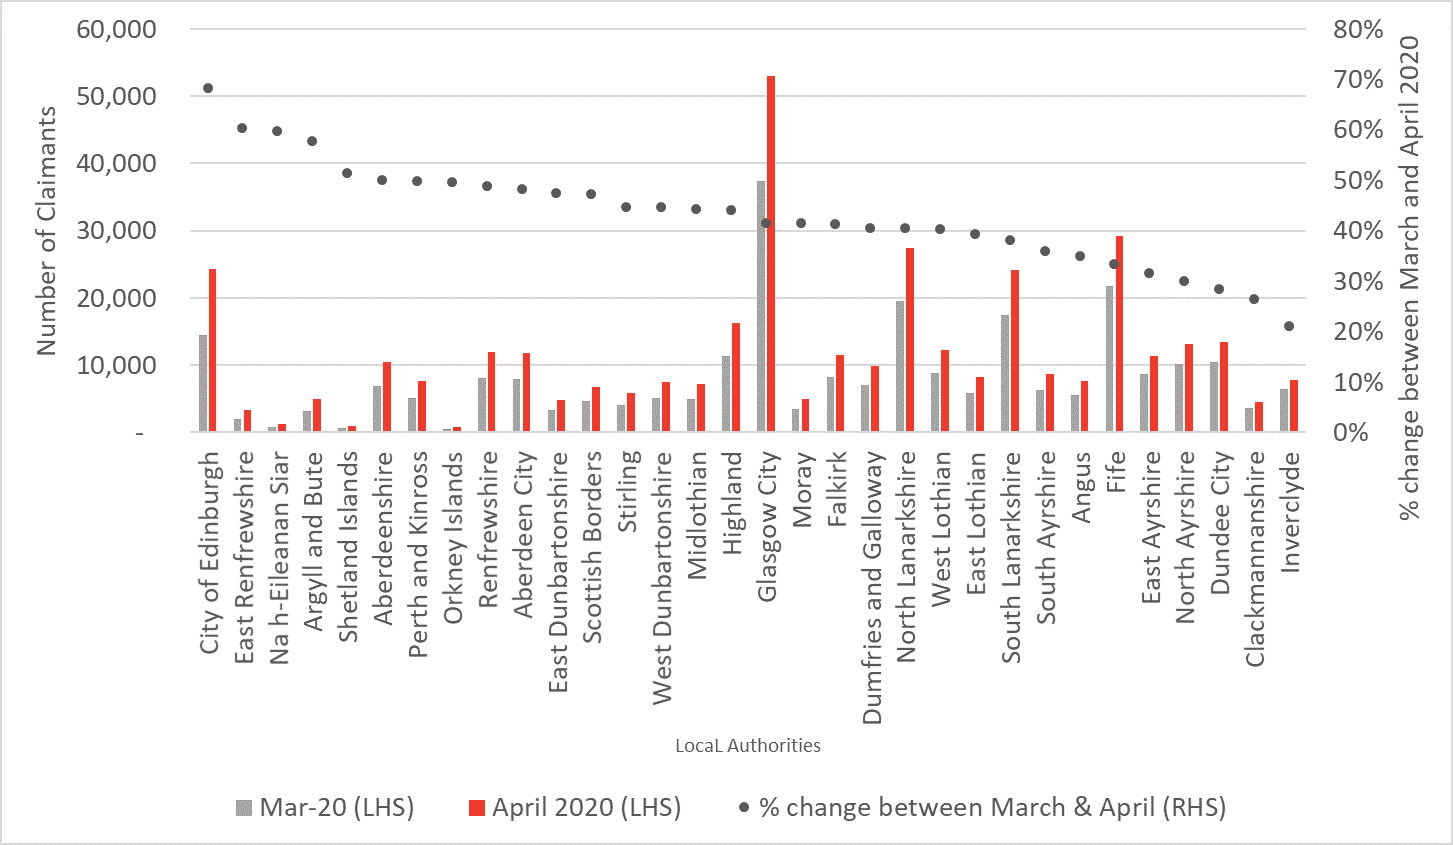
Chart 1 shows which local authorities have seen the biggest percentage increase in the number of people claiming UC. The biggest percentage increase in the number of people on UC is in Edinburgh, with an approximate 70% increase in claimants. In amongst the local authorities with the highest increases are many with large rural communities. This, and the rise in Edinburgh, likely reflects the near total shutdown of the tourism and hospitality sector.
Chart 1 – Change in number of people on Universal Credit by Local Authority
Chart 1 shows that Glasgow has the highest increase in the number of people claiming UC, but this is from a much higher base than the rest of Scotland. It is also due to the fact that Glasgow is the heaviest populated local authority in Scotland. With Edinburgh also relatively densely populated, it makes sense to look at the changes as a proportion of the local population.
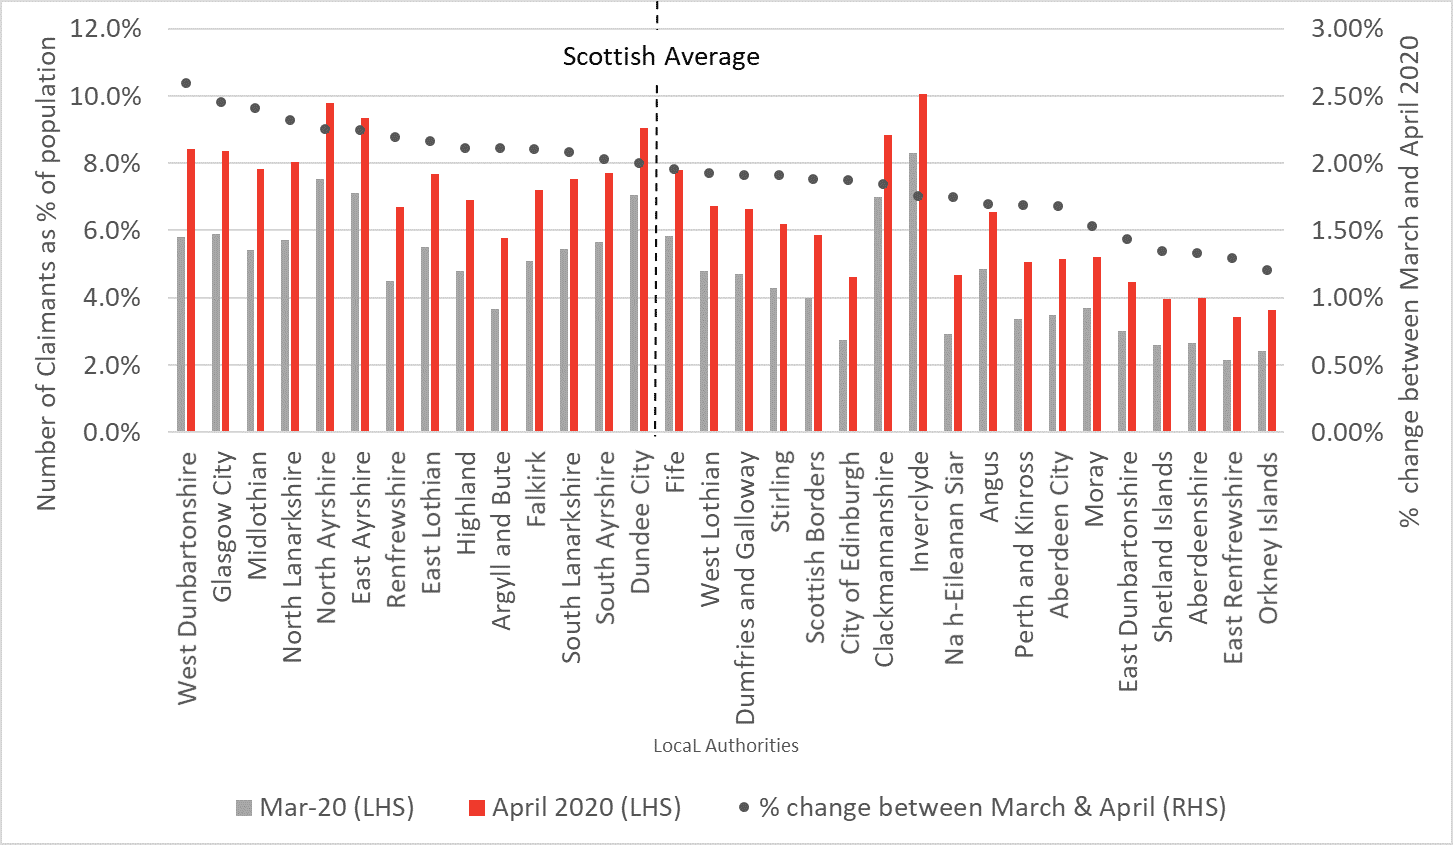
Chart 2 shows the same data but as a percentage of the population in each local authority using mid-2019 population estimates from NRS. Here, Edinburgh has increased its proportion of the population on UC from 2.7% to 4.6% between March and April. Glasgow has gone from 5.9% to 8.4% over the same period.
The percentage increase in the proportion of each local authority on Universal Credit between March and April ranges from 2.6% in West Dunbartonshire to 1.2% in the Orkney Islands. The ordering is similar when considering the working age population only.
At the Scotland level, an additional 2% of the population was on Universal Credit in April compared to March.
Chart 2: Change in number of people on Universal Credit as a proportion of population by Local Authority
There are good reasons why looking at the figures in context of the size of the population is important. Nevertheless, areas that have seen a large increase in the numbers of people on Universal Credit will no doubt see adverse impacts from consumer spend as well as potentially additional reliance on local government services. A big change compared to what you are used to, regardless of proportion of the population that are affected, could be hard for any local authority to deal with.
In addition, a drop in income to UC levels will be challenging for individuals and households regardless of where you live. Any government support should be person centred, rather than focused on where you are currently living.
However, by looking at the figures in the context of the size of population we can see which local authorities already had a large proportion of people struggling financially before the crisis. If they have then seen a relatively large additional proportion of their population moving on to UC this could be compounding existing entrenched issues making it harder for the area to withstand and rebound. It will also likely indicate a harder future for those trying to transition off UC with fewer jobs around.
From this perspective, it is former industrial areas such as West Dunbartonshire, Glasgow, Midlothian, North Lanarkshire and North and East Ayrshire that already had large numbers on UC, and who have seen a larger than average proportional increase, that look worst affected.
There are three notable exceptions to this – Dundee, Clackmannanshire
and Inverclyde. Despite having high number of claimants before the crisis, they have seen lower percentage increases in the proportion of their population affected than those local authorities mentioned above, and indeed many others.
There are many possible reasons for these exceptions, and it makes sense to wait for another tranche of data before jumping to too many conclusions in case this is a temporary blip in the administrative data. But there is some corroboration for the relatively ‘less bad’ performance of Clackmannanshire and Inverclyde from a study on vacancy data by the Institute for Employment Studies. In fact, according to this study, Inverclyde has had the lowest fall in vacancies since March out of any UK local authority (five others have seen a rise in vacancies) and Clackmannanshire is only a few places above with Dundee appearing mid-table. This does also suggest that there is something different going on in these areas. We will return to this subject once more data is available.
Authors
The Fraser of Allander Institute (FAI) is a leading economy research institute based in the Department of Economics at the University of Strathclyde, Glasgow.

