
FAI recently completed a report funded by the Covid-19 Learning and Evaluation Oversight Group analysing the effects of Covid-19 on the labour market and household incomes. This blog presents a summary of key findings.
Using Labour Force Survey (LFS) data up to the first quarter of 2022, we analyse trends in the labour market for groups divided by gender, age, and level of educational qualifications.
We then turn to household income. Having an up-to-date picture of incomes is important for policy analysis, and informs a variety of policy decisions.
However, the distribution of household income, poverty, and inequality are typically calculated from the Family Resources Survey (FRS). FRS data is made available a little over a year after data collection ends, leaving a significant lag in knowledge of incomes.
We use an experimental approach to adjust pre-pandemic FRS data to reflect changes in employment shown in post-pandemic LFS data from the first quarter of 2022.We then use the “updated” dataset to estimate changes in household incomes.
Finally, based on the updated data, we show the post-pandemic income distribution, poverty rates, and inequality.
How has the labour market changed?
The labour market in Scotland changed drastically during the pandemic. Employment fell in sharply at the start of the pandemic, particularly for young people and those with lower levels of education. Hours worked declined, especially in trades and services, but pay remained fairly steady for those in employment.
Ultimately, however, most (but not all) groups seem to have returned to pre-pandemic levels of employment, hours, and pay by the first quarter of 2022.
Men with high levels of education and most women had similar or higher employment rates in the first quarter of 2022 to those at the start of 2020 (Chart 1).
Chart 1: Employment rates by gender and qualification level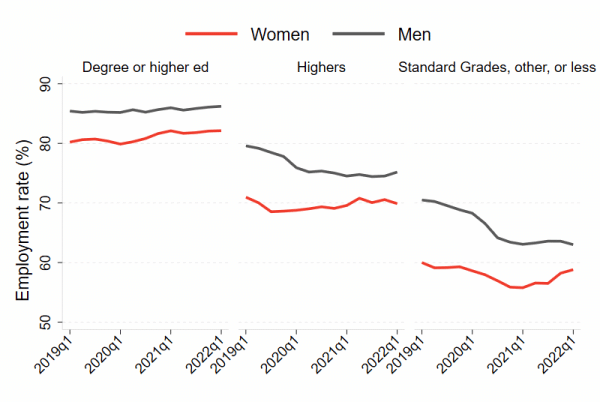
Source: FAI calculations from quarterly LFS data, 2010-2022 (ONS)
Notes: Employment rates are smoothed using an annual moving average to account for seasonality.
Men with lower levels of education, however, had significant drops in employment that have not completely reversed. For example, men with standard grade education or lower had employment rates of about 68% in the first quarter of 2020 and about 63% at the beginning of 2022.
These patterns are also reflected in unemployment, where men with standard grade or lower qualifications reached an unemployment rate of over 10% in mid-2021 and still had an unemployment rate of over 9% in early 2022. Prior to the pandemic, their unemployment rate was about 5.5%.
A similar employment pattern is apparent when people are grouped by age and gender. Women of all ages had slightly higher employment in early 2022 than they did at the start of 2020, but the employment of men aged 50+ fell from nearly 75% to less than 70%.
Unemployment of men aged 50+ was also about 2 percentage points higher in the first quarter of 2022 than it was at the start of 2020.
Lower employment has also led to higher inactivity for some groups, particularly men over 50, although data from mid-2022 indicates that this trend may be starting to reverse in the UK as a whole.
Similar trends are apparent in hours worked, where employed men with less education or aged 25-49 work slightly fewer hours in 2022 than they did in early 2020.
Weekly pay, however, has returned to pre-pandemic levels for most groups. The decline in pay during the pandemic is not as marked as that for hours worked, possibly a sign that furlough schemes were successful in maintaining incomes.
How did incomes change?
Given the lag in availability of household income data, we use a novel approach to update 2019-20 FRS data to match employment patterns from the LFS in the first quarter of 2022.
Individual observations are reweighted to match employment patterns for groups defined by age, gender, and level of qualification.
We then feed the updated data into a microsimulation model and apply current social security and tax policy to get a snapshot of the post-pandemic income distribution, poverty rates, and inequality.
Given that most groups had the same or higher employment, hours, and pay in early 2022 than they did just prior to the pandemic, it is not surprising that we find a slight increase in incomes for most households.
The exception is single-male households, where, consistent with labour market trends, reduced employment and hours have led to a 1% decline in income (Chart 2).
Chart 2: Changes in income by household type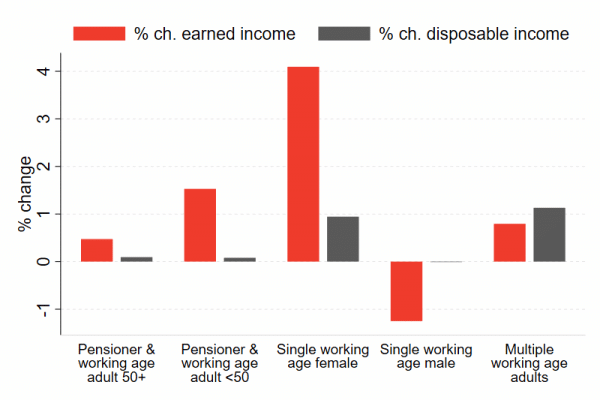
Source: Author calculations from FRS 2019-20 (DWP) and IPPR model v.02.44
Notes: Disposable income is measured after housing costs. Working age refers to adults under 65 and pensioner to those over 65.
In comparison, the type of household with the largest rise in income was single females under 65, with an increase of 4%.
Limitations and future work
Having up-to-date estimates of household incomes is important for a variety of policy questions, several of which are discussed further in our report. This is true even when the labour market and income distribution haven’t changed much, as we find here.
Producing such estimates balances between timeliness and a higher degree of error than is found in official income statistics. Several aspects of the reweighting methodology create uncertainty in the estimates.
First, reweighting is applied at the individual level, but incomes are calculated at the household level. Changes to individual weights may be muted when averaged within the household, dampening the overall effect on estimated income.
Second, estimated individual incomes by group in the updated FRS do not perfectly reflect information from the LFS. The largest differences are for women over age 50, so estimates for households including female members 50+ may have more associated error.
Third, using data from 2019-20 may bias estimates of income if something relating to employment and incomes that is not reflected in our reweighting methodology has fundamentally changed since the survey was conducted.
Ultimately, the only way to verify the estimates is to compare results from the updated 2019-20 FRS to those calculated from the actual 2021-22 FRS, due to be made available next year.
In future work, we hope to verify our results, refine this method and means of testing its accuracy, and compare results from reweighting to those from alternative methods of updating survey data.
Read our complete analysis and methodology here.
Authors

Hannah is a Fellow at the Fraser of Allander Institute. She specialises in applied social policy analysis with a focus on social security, poverty and inequality, labour supply, and immigration.

Emma Congreve is Principal Knowledge Exchange Fellow and Deputy Director at the Fraser of Allander Institute. Emma's work at the Institute is focussed on policy analysis, covering a wide range of areas of social and economic policy. Emma is an experienced economist and has previously held roles as a senior economist at the Joseph Rowntree Foundation and as an economic adviser within the Scottish Government.

David Eiser
David is Senior Knowledge Exchange Fellow at the Fraser of Allander Institute