Last month, the ONS published updated statistics on regional GVA for the nations of the UK and English regions.
The data is interesting as it is one of the few (macro) economic datasets produced that allows for comparisons within the UK.
There has been much talk of the dominance of London in the UK economy. But how big is the gap between London and the other parts of the UK in terms of output per head? And has the gap widened or narrowed in recent years? How has Scotland faired, not just relative to the UK as a whole, but against the other devolved nations and English regions?
The data
The ONS data series contains GVA per head data for the 12 ‘Government Office Regions’ (GORs) of the UK.
There is a 13th region – ‘Extra Regio’ – which captures activity that takes place outside the UK landmass. This includes things like UK embassies. But importantly it includes economic activity within the UK Continental Shelf (principally oil and gas extraction from the North Sea).
Onshore Scotland is included as one of the twelve GORs. Of course, it is possible – as the Scottish Government do here – to add in a geographical share of extra regio activity to obtain a comprehensive measure of Scottish economic activity (both onshore and offshore).
For the purposes of this blog – like the headline GDP statistics– for Scotland – we focus on the onshore economy.
An important couple of caveats. Firstly UK regional data, whilst national statistics, has wider confidence intervals compared to UK data as a whole. Interpretation should therefore focus upon overall trends rather than specific point estimates.
Secondly, GVA should only be seen as a proxy measure for economic activity and comparator of economic performance rather than a measure of ‘economic well-being’.
How does Scotland compare?
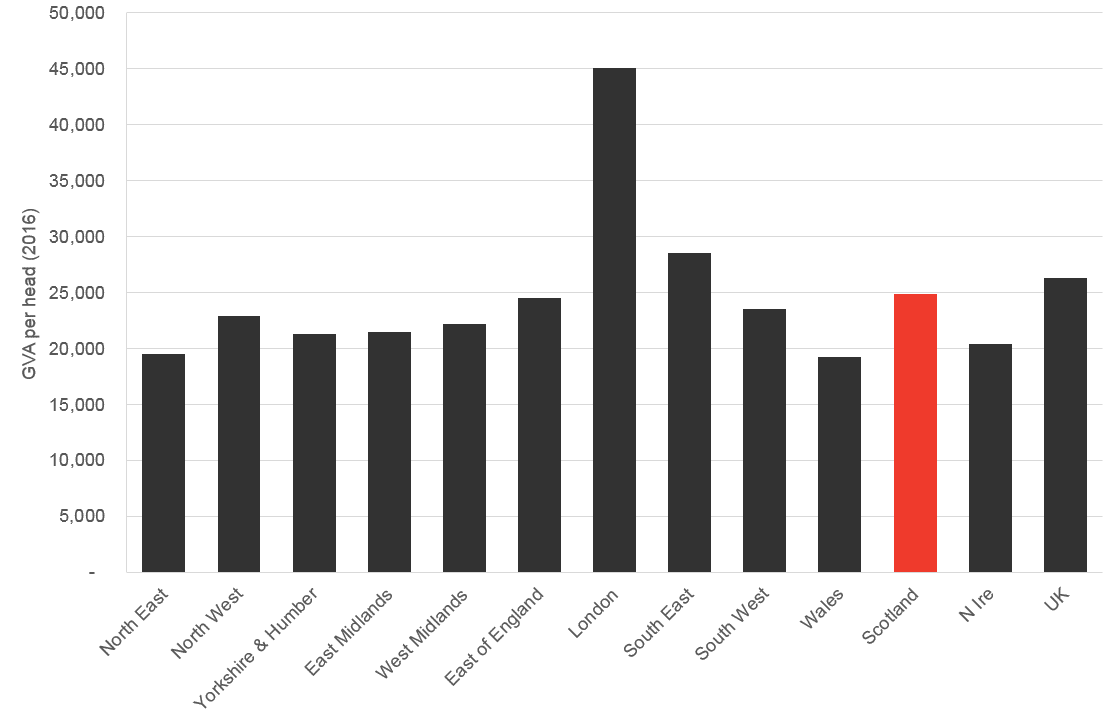
As Chart 1 highlights, Scotland’s onshore GVA per head is just below £25k at £24,876 in 2016.
In terms of ranking, Scotland currently sits 3rd behind London and the South East (where GVA per head is £45,046 and £28,506 respectively).
Chart 1: GVA per head across the UK (2016)
Source: ONS Regional GVA
It is also possible to track Scotland’s relative performance to the UK – and its constituent parts – over time.
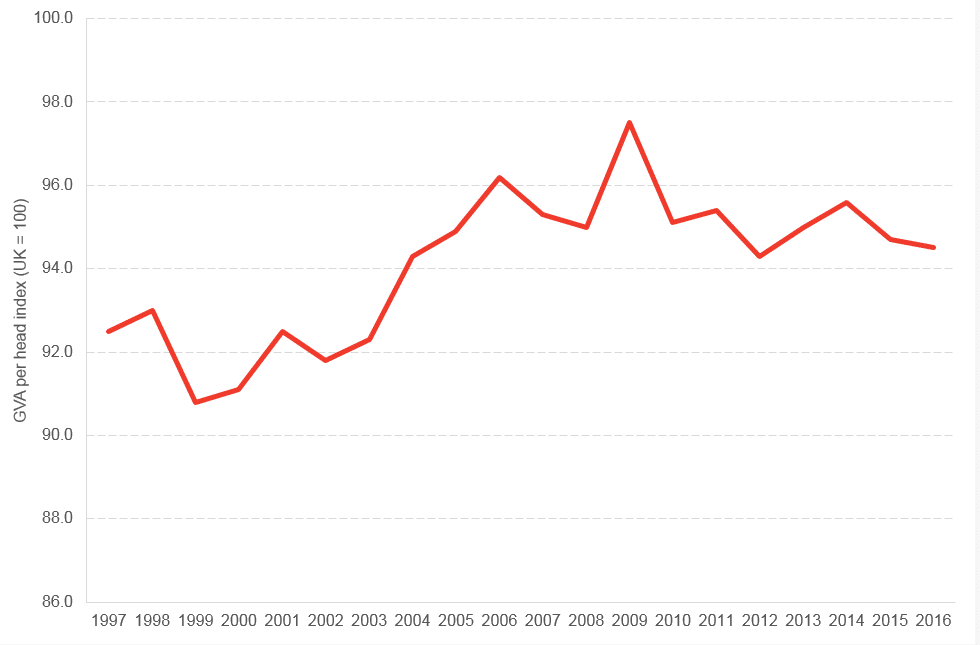
Chart 2 shows onshore Scotland’s relative position compared to the UK starting in 1997 (excluding extra-regio from the UK as well).
Overall, onshore Scotland has narrowed the gap with the UK average over time in terms of GVA per head (although consistent with other data it has slipped back a little from its peak in recent years).
Chart 2: Scottish GVA per head vis-à-vis UK (excluding extra-regio) average, UK = 100 (2016)
Source: ONS Regional GVA
Scotland has also performed better in relative terms to other parts of the UK.
Back in 1997, Scotland was ranked 5th out of the 12 different parts of the UK – behind London, the South East, the South West and the East of England.
Scotland now sits 3rd behind London and the South East.
The (im)balance of the UK economy
One thing that is striking from Chart 1 is the significant variation that exists in terms of GVA per head across the UK.
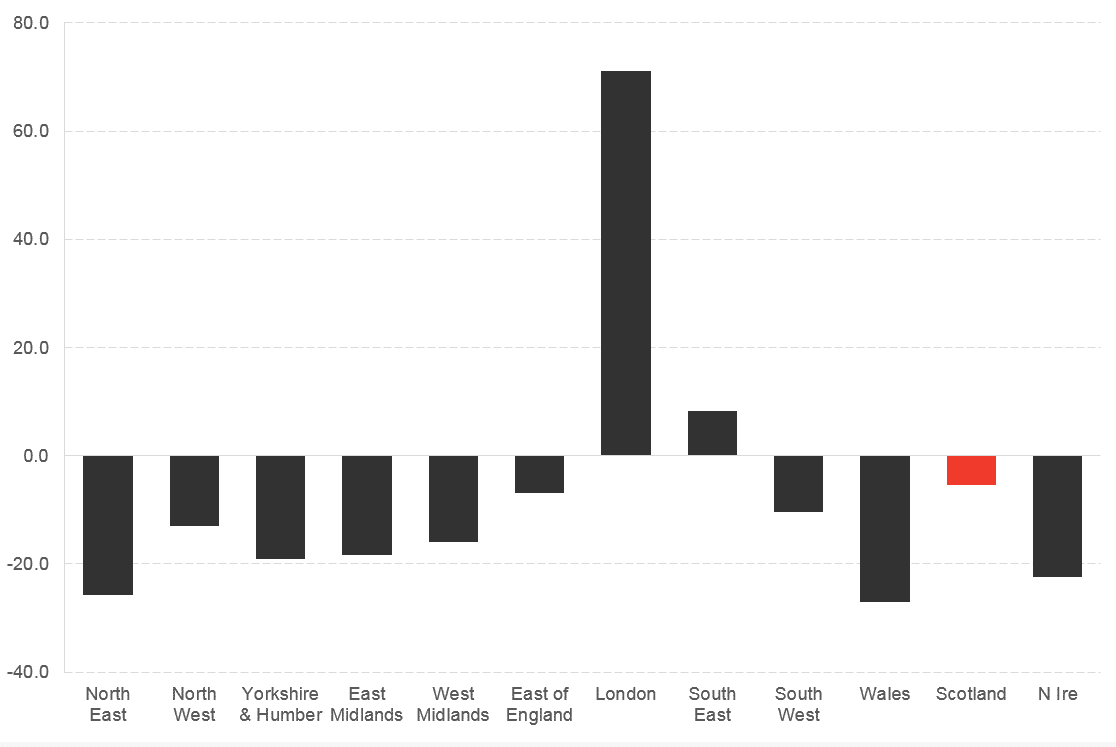
Taking the UK average as 100, the chart below shows the relative position of each different English region or devolved nation. A figure of -5, indicates that this part of the UK’s GVA per head is 5% below the UK average (and so on).
As Chart 3 highlights, only London and the South East are above the ‘UK average’.
Chart 3: GVA per head, difference from UK (excluding extra-regio) average (2016)
Source: ONS Regional GVA
London is an exceptional outlier – with GVA per head over 70% higher than the UK average.
Of course, the figure for London as a whole hides a great degree of variation within the city. For example, GVA per head in the centre and west end (i.e. including the City and places like Kensington and Chelsea) is over £145,000.
Chart 3 also shows that the two other devolved nations – Wales and Northern Ireland – perform considerably worse than Scotland. Indeed, Wales has the lowest GVA per head figure for any part of the UK.
Have these imbalances got bigger or smaller in recent years?
You might think that the dominance of London on the UK national economic accounts may have been curtailed in recent years given the financial crisis.
But the opposite is the case.
As the table below highlights the ratio of London GVA per head to UK GVA per head has widened over the last decade.
Indeed over the last 10 years, London was the only part of the UK which improved its relative position vis-à-vis the UK average.
Table 1: GVA per head, 2006 to 2016, vis-à-vis UK average (excl. extra-regio)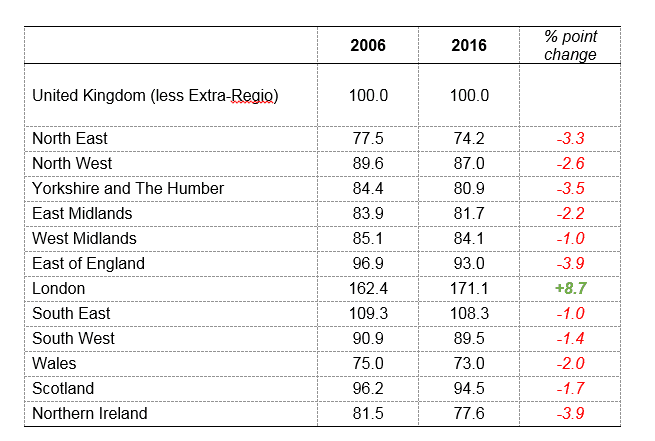
Source: ONS Regional GVA
Whilst Scotland has slipped back a little, it has done better than many other parts of the UK. This is not to say that all parts of the UK outside of London contracted. Instead it’s simply the pace of growth in GVA per head in London was that much faster than in anywhere else.
Regional inequality in Scotland
Before we get too carried away just focussing upon regional inequality at the UK level, the same data also shows the substantial regional inequality that exists within Scotland.
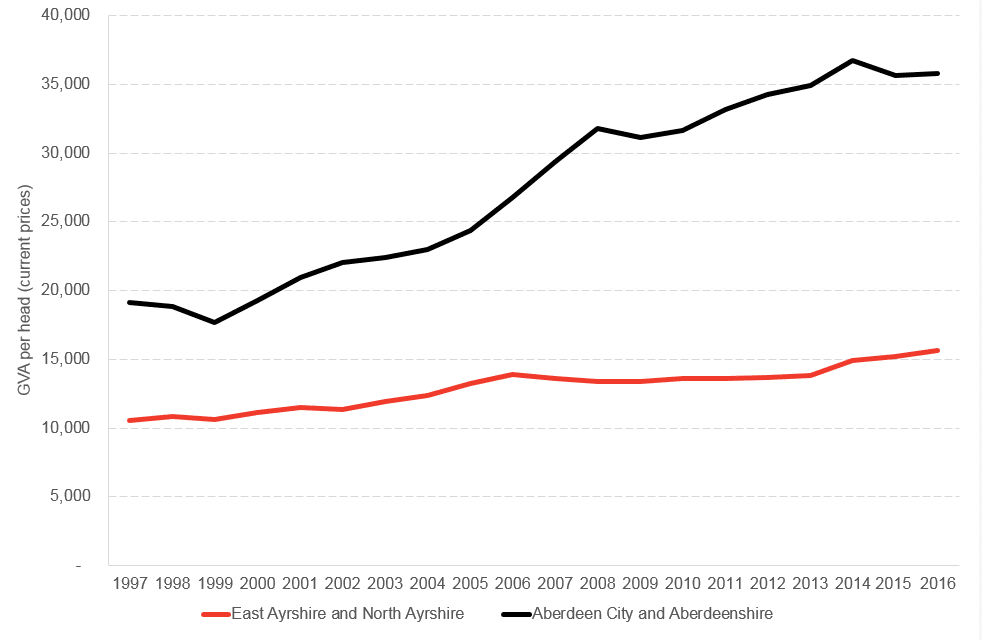
Chart 4 shows GVA per head (in current prices) for the richest part of Scotland – Aberdeen and Aberdeenshire – and contrasts that with East Ayrshire and North Ayrshire which has the lowest GVA per head in Scotland.
Chart 4, GVA per head Aberdeen City & Aberdeenshire, East Ayrshire and North Ayrshire, 1997 to 2016 (current prices)
Source: ONS Regional GVA
Between 1997 and 2016, GVA per head in Aberdeen and Aberdeenshire increased by nearly 90%. In contrast, growth in East Ayrshire and North Ayrshire was just over ½ this at 48%. Thus the gap been the best and most challenging regions of Scotland has actually widened.
So what does this tell us about regional economic performance?
GVA is always going to be an imperfect measure of how ‘rich’ a particular region is. However, it provides – at the very least – a useful indicator of relative economic performance (and concentration of economic activity).
The latest figures suggest that far from narrowing in the UK (and also in Scotland) measures of regional inequality in terms of economic activity are widening.
There has been much debate about inclusive growth and regional re-balancing both from the Scottish Government (through its inclusive growth strategy) and the UK Government (through its industrial strategy).
Policymakers often significantly over-estimate their potential to influence growth rates and it is unrealistic to expect that either the UK or Scottish Governments can implement a quick-fix policy that would eliminate regional disparities.
But where these regional differences are producing outcomes for people which are markedly different in terms of earnings, consumption and wellbeing this data suggests that current approaches are having little effect at reversing these trends.
Authors

Graeme Roy
Dean of External Engagement in the College of Social Sciences at Glasgow University and previously director of the Fraser of Allander Institute.