Today we’ve received new labour market statistics from the ONS. It is important to note at the outset that these relate to the period before the UK economy went in to lockdown.
This means that the data today tell us little, if anything, about how the economy is doing right now. But they do tell us about the health of the labour market going in to this pandemic.
In this article, we do three things: examine what the labour market data released today tells us, set out what other data are available that shed light on or scenario for the path of the economy at the moment, and set out the key timings for future data releases on the economy.
Today’s data
First, the headline numbers show that the Scottish unemployment rate was 3.7% in the three months to the end of February (compared to the UK which was 4%), this is down -0.1%-points on the previous 3 months.
Meanwhile the employment rate was 75.4% (compared to 76.6% in the UK as a whole), which is up +1.1%-points on the previous 3 months.
The economic activity rate was 21.6% (compared to 20.2% for the UK as a whole), this is -1.0%-points on the previous 3 months.
None of these statistics relate to the period after the economy went in to ‘lockdown’, they tell us only about the condition of the labour market heading in to the current crisis.
Some ‘experimental’ statistics (i.e. not designated as National Statistics) on Job Seekers Allowance and some elements of Universal Credit cover the period up to 12th March, these again relate to the period before the economy went in to lockdown.
For this reason these show little change, with 112,000 people in Scotland shown as being in receipt of this support which is basically unchanged from the month before.
If the usual labour market data don’t tell us much about where the economy is now, what other sources can we look at?
Well, one thing that ONS have spent a lot of time doing in recent weeks is pulling together faster indicators of economic activity. They are releasing these weekly. The latest one was released last Thursday and you can read it here.
The measures that ONS is producing don’t substitute for traditional metrics like GDP, unemployment, etc, but pulled together they shed light on the scale of impacts that the pandemic is having on different aspects of the economy.
For example, they have instituted a new fortnightly survey of businesses called Business Impact of Coronavirus Survey which looks at the effects on the workforce, such as working at home, furloughing of staff and changes in the number of employees. They have also put new questions in to their core labour market surveys and have been working on other new labour market indicators, see this ONS blog for a summary.
As part of this, the ONS have released earlier data from a new set of indicators on earnings and employment leveraging data they have been working with HMRC to develop. Ordinarily these data were released with a delay of 6-7 weeks after the period they related to, but ONS and HMRC have reduced this significantly for the employment indicator, providing an early indicator of ‘Pay as You Earn’ (PAYE) employment in March. These data can be accessed here.
They show that the number of people in paid employment in the UK fell ever so slightly in March relative to February (-0.06%), but was still up +0.8% points relative to the same period in 2019. Again, it’s important to reemphasise that these are only very early data, covering a month which included a period before and after the economy went in to lockdown.
It is also the case that the different employment support schemes that the UK Government has brought in through the current crisis may be keeping people on payroll when they might otherwise not be.
These new data also provide initial estimates of growth in PAYE pay in the three months to the end of February 2020. For the UK as a whole median monthly pay was +3.6% in February 2020 relative to the same period the year before. Across the UK this growth was strongest in Scotland +4.1% and lowest in Northern Ireland (+2.4%).
In times of economic disruption survey indicators can provide a good first pass at understanding what is going on in the economy.
Last week we released our own Scottish Business Monitor results providing the first indication of the impact CoVid is having on the economy.
In this article we set out the headline results, and in this one we set out the results with a breakdown by sector.
Chart: Net balance (%) of firms expecting an increase in their volume of business over the next six months, Q1 1998 – Q1 2020
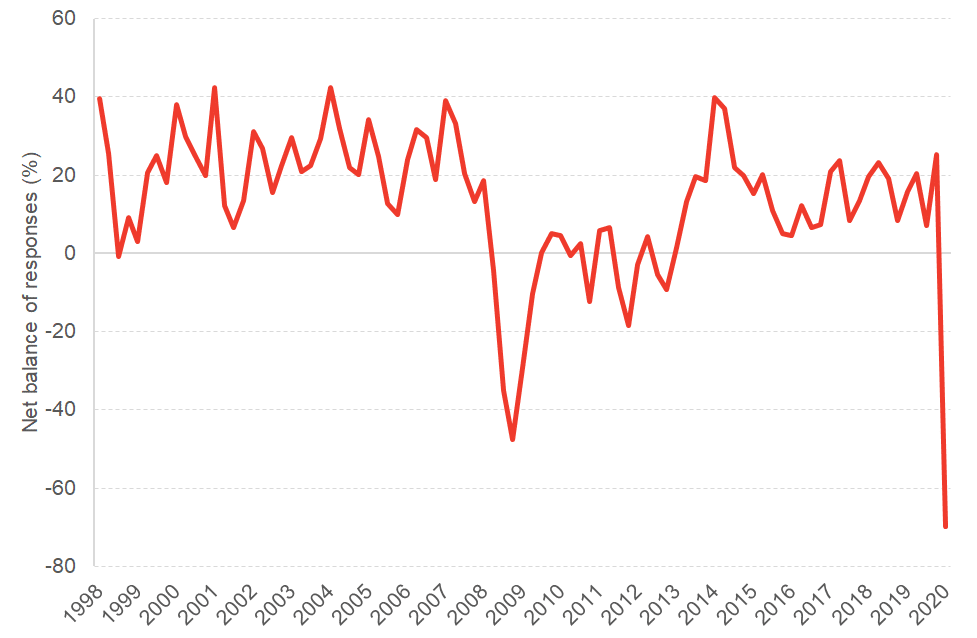
Suffice to say that the picture is a challenging one with the worst outlook we’ve ever recorded in the survey. This is reflected in the majority (54%) of firms indicating that they expected they could survive less than three months under current levels of trading.
We also had the release of new Purchasing Manager’s Index (PMI) data for the different parts of the UK. This is a survey of supply chain managers conducted across the UK and internationally and is one of the main internationally comparable early indicators of economic activity. Again here, the picture is a challenging one.
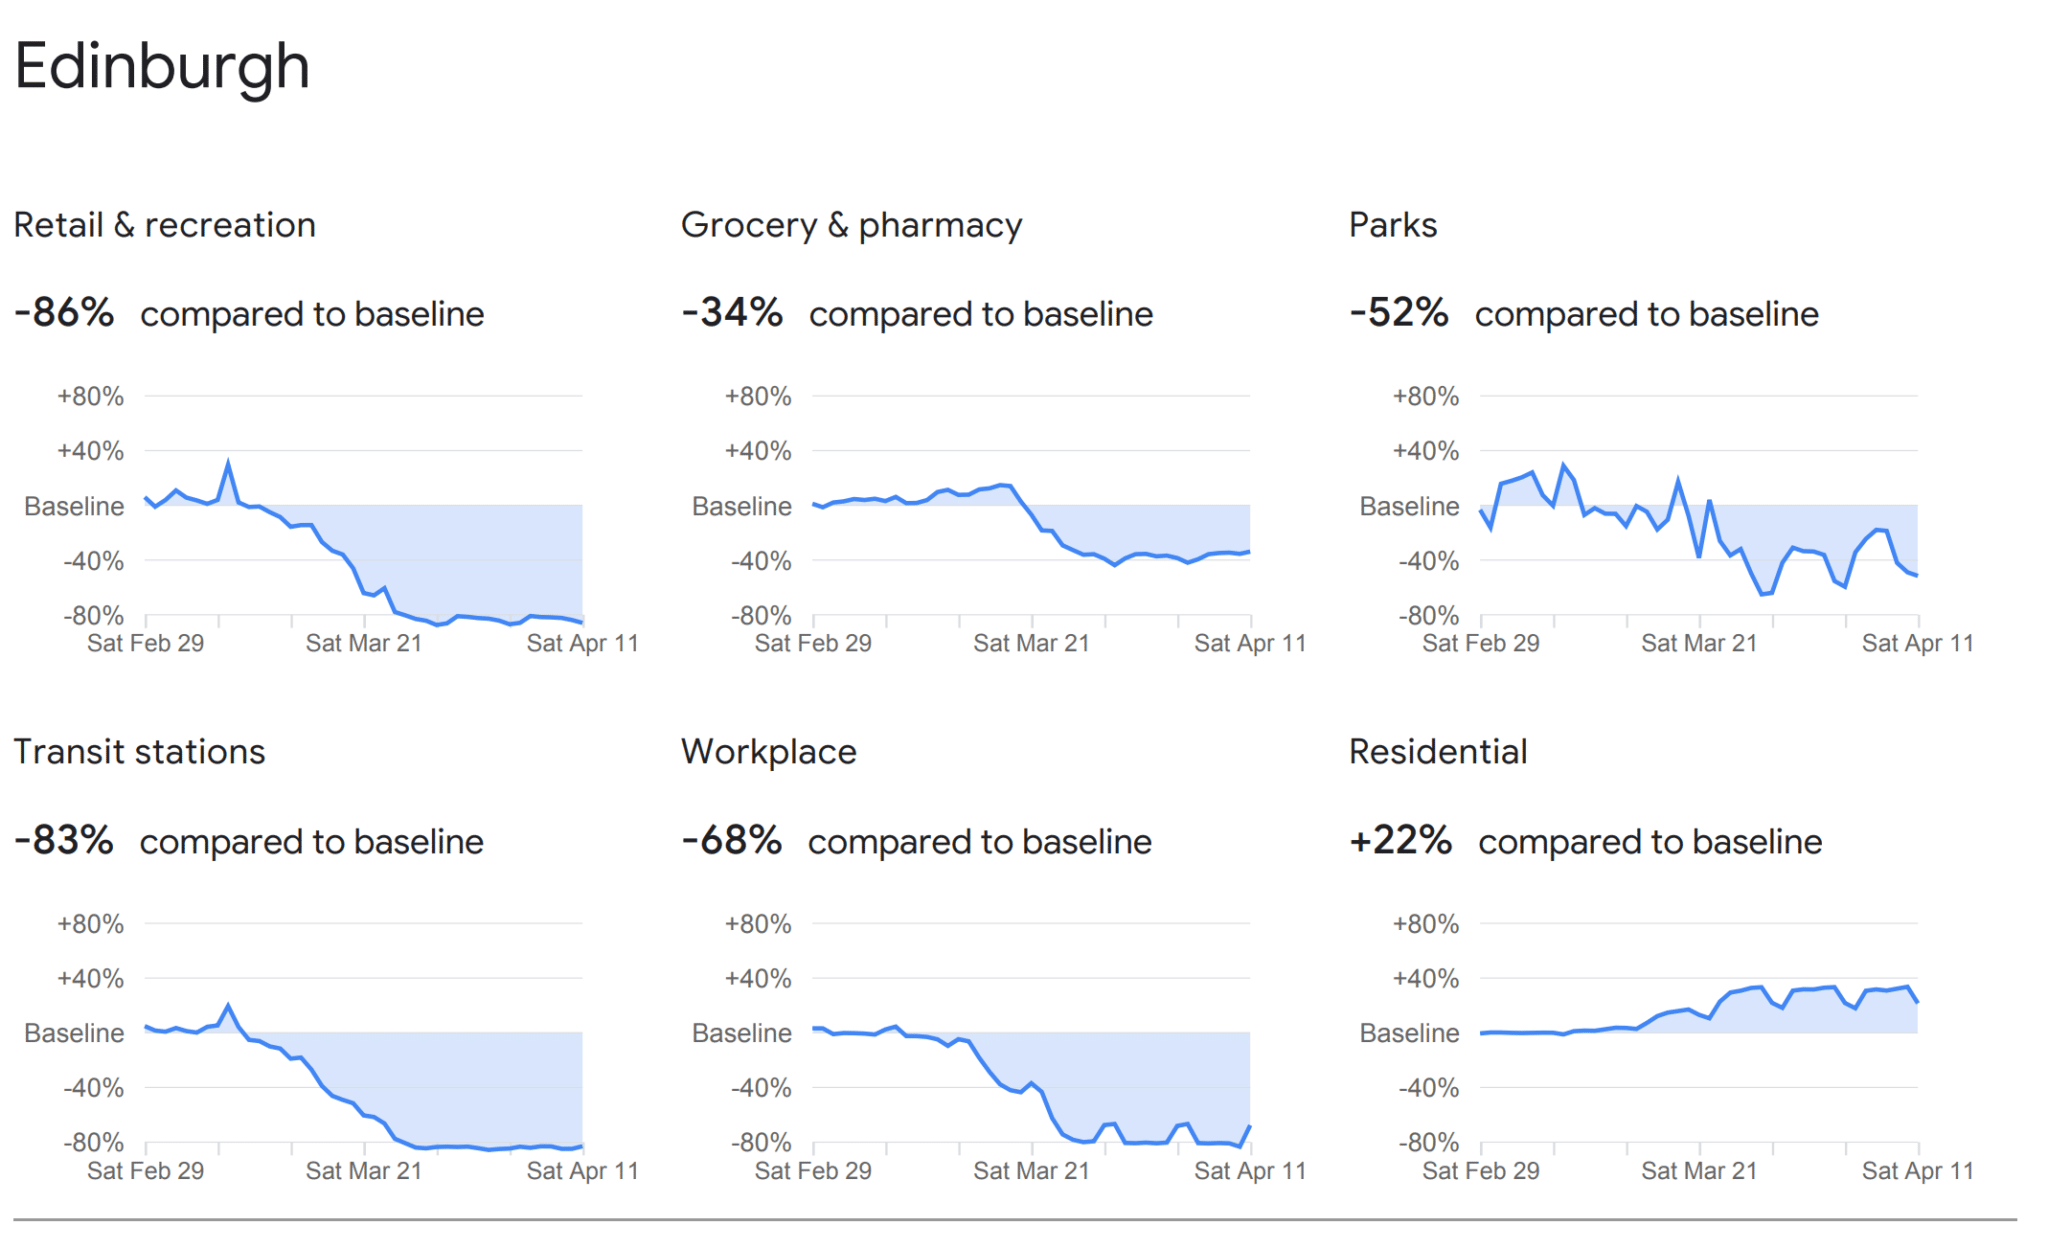
Leveraging mobile phone data both Apple and Google have produced interesting data on how patterns of activity have changed over the past few weeks. The Google data provide breakdowns by local authority within the UK (with some caveats around sample sizes for some indicators in some local authorities) while the Apple data are mostly UK wide. The Google data suggests that mobility trends around retail and recreation are down -81%, and -57% for workplaces. Huge numbers.
Chart: Example Google Mobility data for Edinburgh
Scenarios
Beyond early indicators of what is happening now, we also recently saw the Office for Budget Responsibility publish a set of scenarios (not forecasts!) for how the UK economy might react under some assumed parameters. The headline suggestion was that under these assumed conditions, GDP could drop by 35% in the 2nd quarter of 2020. A drop in GDP of that magnitude combined with the increased expenditure by the UK Government in response to the pandemic, would see the UK deficit spike to 14% of GDP in 2020-21.
NB: We’ve seen some unfair criticism of the OBR suggesting that they are predicting a v-shaped recession. They are not. And they explicitly say so. Their published work was a scenario designed to update their forecasts for the fiscal deficit (as they are obliged to do).
We have modelled our own scenario for the Scottish economy. Which we reported here.
This involved looking at two main things: the relative scale of different sectors in the Scottish economy to see how changes might impact upon the overall level of activity; and emerging evidence and intelligence from businesses and other sources – including from our Scottish Business Monitor – to get a handle on the scale of the drop-off in demand we’re seeing reported.
Doing this, we estimate that if similar restrictions continue for a 3-month period, that Scottish GDP could contract by around 20-25% from April onwards (on the back of a fall in March too taking the full impact to be larger still).
Now all of these are scenarios for how the short-term could evolve, and are not forecasts. In looking beyond the immediate term, key will be what how long the lock down lasts for, how restrictions/guidance are unwound and how quickly businesses can get back on their feet. It will be some time yet before anyone can make reasonable assumptions about these elements to produce reliable forecasts.
Going forward – milestones for data…
So when will we start to get real data on how the economy is performing?
Over the coming weeks and months we will get regular updates from organisations such as the Bank of England and the ONS. Key ones to keep an eye on will be the Bank of England’s Agents survey, which is usually published around the time of the Monetary Policy Committee meetings.
In terms of ‘official’ statistics, the first set of labour market data covering March 2020 will be released next month. However even these may not provide a completely clear picture of what is happening in the labour market. At a minimum the confidence intervals around key statistics are likely to be wider.
It is unclear at this stage how workers who are furloughed will be counted in the labour market data – the expectation will be that they will be counted as ‘employed’ rather than ‘unemployed’ (i.e. whilst they might not be working they will still be in employment). The same is expected to be the case for the self—employed.
As a result, this data is likely to hide the scale of the challenge at least initially – it will only be once we know what will happen to these furloughed or self—employed when the restrictions are lifted and financial support to firms and the self—employed is withdrawn (i.e. will they still be in jobs or will they become unemployed).
Nevertheless, there is still expected to be a spike in unemployment when the data are released – for example as people not eligible to be furloughed or to access support for the self—employed register as unemployed.
On the 13th May we will get GDP data for the UK economy in the first 3 months of the year. This will cover the initial part of the lockdown. Equivalent data for Scotland are due out in June. Data for UK growth in Q2 will be released in August of this year, with the Scottish data following in September. We discussed here some of the challenges faced in constructing these data at the moment – and the issues that the ONS and Scottish Government will be wrestling with.
It will, of course, take a long time to fully understand the impacts on the shape and size of our economy of the current pandemic.
Firstly, the initial estimates of the hit to the UK economy released next month for Q1 and in August for Q2 will not be the final estimates.
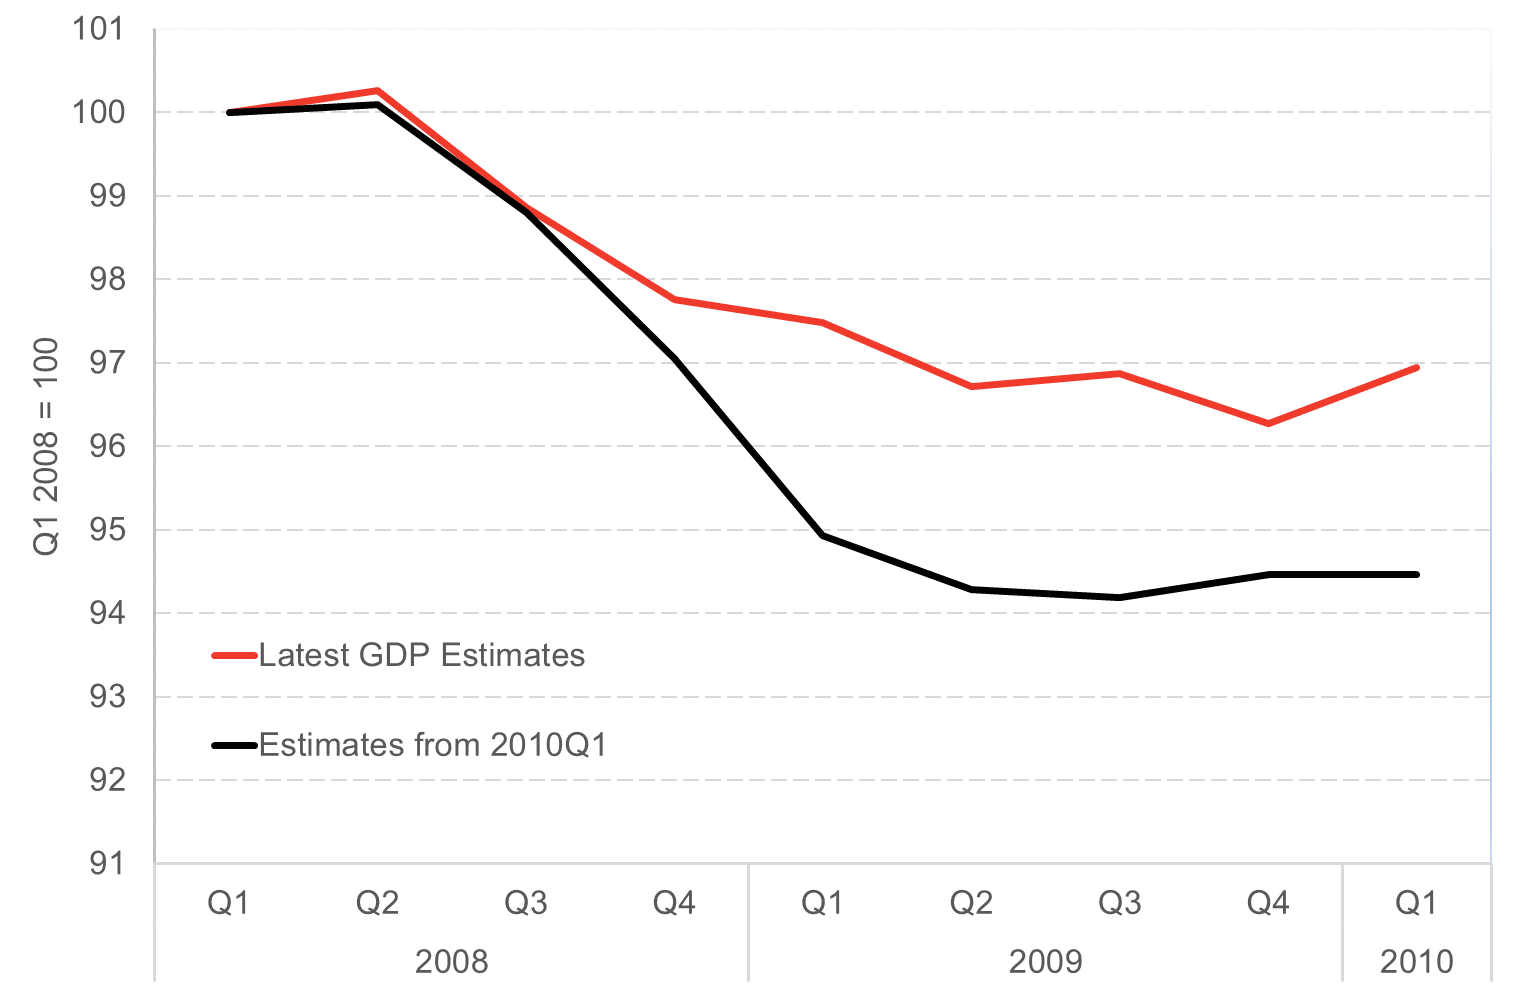
Through the normal revisions process headline estimates of the expected GDP contractions will be revised as new and better data emerge. This is exactly what happened with the global financial crisis. Initial estimates of the drop in GDP from the ‘peak’ to the ‘trough’ were around 6%, but are now estimated to be around 4%.
Chart: Example of how GDP revisions changed our understanding of the economic effect of the GFC
Initial estimates are revised and our understanding of the true impact of the crisis is improved as we get more information. It is worth cautioning though, that for some sectors with a distinct seasonal pattern it may take a year or more to fully understand the impact of CoVid19.
Secondly, what matters of course is not just the scale of the downturn itself but the recovery that follows. ‘If’ there is some bounce-back in the economy later on in 2020 then, it will be well into 2021 before we get an official estimate of how this might look.
Indeed, for official statistics on things like poverty, earnings and the business-base for Scotland, it will be well into 2021 and even 2022 before we start to get the full picture.
Conclusions
We’re at the beginning of the process of understanding how the current pandemic has affected and reshaped our economy.
We have much better early indicators of the economy than we had a decade or so ago during the financial crisis and these are helping guide policy much more effectively as a result.
Coupled with this, the work that the OBR has done has enabled a much better understanding of the impact of this crisis on the whole economic/fiscal ‘system’, helping make clear the scale of the challenge and the policy response.
It will take some time for more traditional indicators of economic activity to catch up, and when they do they will be early estimates and revisions to these should be expected. It is only in time that we will begin to fully understand the shape of the post CoVid economy.
Authors
The Fraser of Allander Institute (FAI) is a leading economy research institute based in the Department of Economics at the University of Strathclyde, Glasgow.