
Scotland is a country that many people from a diverse range of backgrounds call home. Minority ethnic adults represented 4.6 % of people in Scotland in 2018 according to the ethnicity population overview on the Scottish Government’s Equality Evidence Finder.
However, economic exclusion for minority ethnic groups is a prevalent feature of our society, manifested through poorer labour market outcomes.
This article looks firstly at the evidence on labour market outcomes, and then explores some of the known reasons for these, on average, poorer outcomes. Lastly, we look at some of the implications of economic exclusion, including insights brought to the fore by Covid-19, and work that is going on in Scotland to try and improve outcomes.
This article uses the term minority ethnic throughout to refer to the non-white population. For more information, see the note at the end of this article on issues around terminology and data availability.
-
Employment and economic activity are lower, on average, for people from minority ethnic groups
The average employment rate for minority ethnic groups is 59%. To put this into context, this employment rate is far lower than the rate seen in the worst performing local authorities in Scotland, places where there is a long history of structural unemployment and inactivity: Glasgow, Inverclyde and Dundee all have employment rates above 67%.
Lower employment rates are true for both men and women from minority ethnic groups although the ethnicity employment gap is larger for women than for men.
Chart 1: Employment rates (2019)
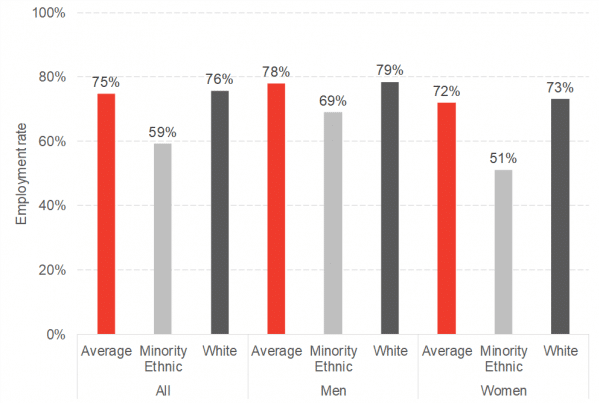
Source: Scotland’s labour market, People Places and Regions, Scottish Government & NOMIS
What is behind the lower levels of employment? Chart 2 shows employment rates alongside unemployment and inactivity. Unemployment rates are slightly higher for minority ethnic groups, but the largest difference is in economic inactivity.
Chart 2: Employment, unemployment and inactivity (2019)
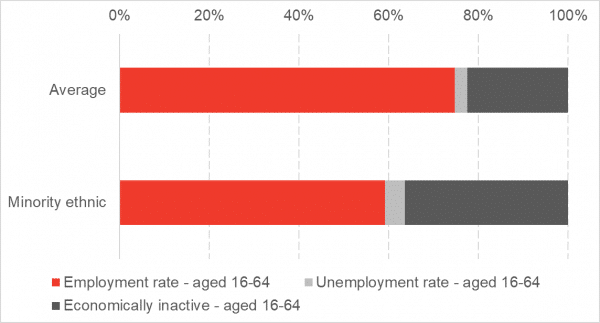
Source: Nomis
Chart 3 looks at economic activity in more detail. Economically active means people are either in paid work (employed) or looking for paid work (unemployed). Economically inactive means that people are not looking for paid work and can be due to illness, studies, or caring responsibilities (often referred to as unpaid work).
Chart 3 also shows a disaggregation by different ethnic groups. With the exception of mixed ethnicity males, economic activity rates are lower amongst all groups and particularly for women.
Chart 3: Economic activity by ethnic group and gender (2019)
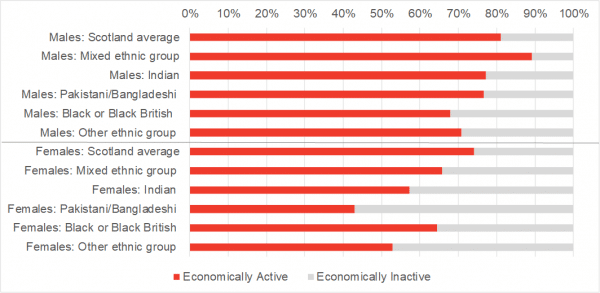
Source: Nomis
2. Pay is, on average, lower for minority ethnic people
For those in work, we see a tendency for minority ethnic groups to receive lower pay than their white peers.
According to ONS research, the pay gap in Scotland between white employees compared to minority ethnic groups was 10.2% in 2018.
Part of the reason for this pay gap is explained by sectoral splits which are shown in Table 1.
Table 1: Top 3 sectors of employment by ethnic group (2019)
| Ethnic group | Most popular sector | 2nd most popular | 3rd most popular |
| White | Human health and social work activities | Wholesale and retail trade | Education |
| Average for all minority ethnic groups | Human health and social work activities | Accommodation and food service activities | Wholesale and retail trade |
| Mixed/multiple ethnic group | Human health and social work activities | Accommodation and food service activities | Education |
| Indian | Human health and social work activities | Wholesale and retail trade | Accommodation and food service activities |
| Pakistani | Wholesale and retail trade | Transport and storage | Human health and social work activities |
| Chinese | Accommodation and food service activities | Other | Wholesale and retail trade |
| Any other Asian background | Accommodation and food service activities | Wholesale and retail trade | Human health and social work activities |
| Black/African/Caribbean/Black British | Human health and social work activities | Wholesale and retail trade | Financial and insurance activities |
| Other ethnic group | Accommodation and food service activities | Wholesale and retail trade | Human health and social work activities |
*Sample size for Bangladeshis too small to report separately
Source: Annual Population Survey, NOMIS
In common with the white population, there is a high number of people in minority ethnic groups working in the human health and social work sector (encompasses a range of pay rates) and in wholesale and retail trade (generally low paid). However, they are proportionately more likely to work in the Accommodation and Food Services sector than the white population, which is predominantly a low paid sector compared to the third most popular sector for the white population which is education.
Whilst there are similarities, employment by sector is not completely homogeneous across minority ethnic groups. For example, transport and storage is a common sector for Pakistanis, and financial and insurance activities is relatively common for the Black/African/Caribbean/Black British population.
3. What are origins of poorer labour market outcomes?
There are a number of reasons that help explain why there are poorer labour market outcomes. For example, analysis on ethnicity pay gaps by the ONS at the different reasons why differences in pay exist, for example, white British employees are, on average, older than the minority ethnic employee average and pay tends to increase with age. However, even after controlling for a range of factors including country of birth, age, sex, qualifications, sectors, occupations and disability status, statistically significant pay gaps remained for most minority ethnic groups.
Discrimination on grounds of race and religion exists is prevalent in Scotland. A survey commissioned by the University of Edinburgh in 2019 reported more than a third having experience of discrimination in the last two years, with 89% of these believing it was because of their perceived ethnicity. Of those who experienced discrimination, 25% said it had happened whilst applying for a job and 18% said it had affected their promotion chances.
Results from the most recent Scottish Household Survey also show minority ethnic groups are more likely to have experienced discrimination. 17% of minority ethnic respondents said they had experienced discrimination in the last 12 months compared to 8% of white respondents.
As well as discrimination on the basis of ethnicity, there is likely to be intersectionality with issues around gender which add to the issues facing women from minority ethnic groups and are likely to be a key reason why inactivity rates are much higher for women from minority ethnic groups than men.
4. What are the implications of poorer labour market outcomes and what is being done?
The combination of lower paid jobs on average and higher rates of economic inactivity means that is unfortunately of little surprise that poverty rates are on average higher for minority ethnic groups.
Chart 4: Poverty rates by ethnicity (2013 – 19)
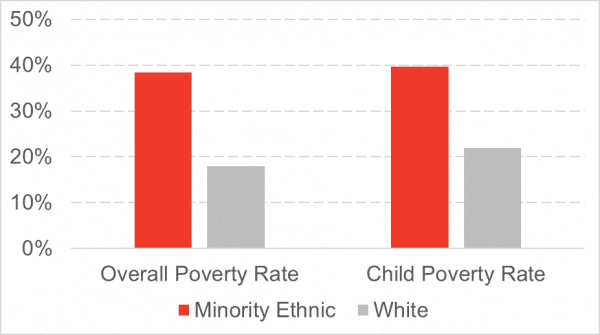
Source: Households below average income, DWP
Living in poverty leads to a range of issues, including impacts on long term health. The vulnerability of those with underlying health conditions to Covid 19 has been widely talked about, and as in England, there is evidence of a higher mortality rate for some ethnic groups in Scotland. The link between lower socioeconomic status and higher mortality has been made, and this is likely to be one of the factors that links being in a minority ethnic group to higher mortality as well as related factors such as prevalence in low pay sectors with more exposure to the virus.
In addition, as set out in this article for the ESRC Coronavirus Economic Observatory, the coronavirus outbreak risks exacerbating many of the economic inequalities already in existence due to, for example, the higher proportion of people working in shutdown sectors such as Accommodation and Food Services.
Much is left to be understood around the impact of Coronavirus, both in the short term and the long term, but evidence suggests that it is highlighting underlying inequalities that have been present for many years.
Recently, the Scottish Government’s response to the Advisory Group on Economic Renewal reinforced the intention to ensure the inclusion of typically excluded groups, including minority ethnic groups, are embedded in economic recovery. This will hopefully build on what has already been learned from the implementation of the Race Equality Strategy. The most recent update published in March 2020 notes a number of initiatives, including trying to improve the numbers of under-represented groups in public sector employment. A full progress report on the first three years of the Race Equality Action Plan is due to be presented to parliament in Spring 2021.
Although Covid-19 has presented new challenges, understanding whether previous initiatives have worked (or not), and if there is evidence that long term trends had started to shift as a result, will be crucial to knowing how to get back on track post-pandemic. Effective ‘new’ action must learn from what has gone before.
A note on data and definitions:
There are numerous terms used to categorise ethnicity, and none appear to be wholly encompassing or accepted. Whilst use of terms that group together ethnicities can be helpful for identifying common issues, for example racism, it is problematic that often data can’t be disaggregated further. Survey data, relying on samples, struggle to capture the different groups who live here in Scotland and often have to combine together different groups in order for the sample to be large enough to ensure statistical accuracy. Improved data on ethnicity is an action in the Scottish Government’s Race Equality Action Plan.
The term ‘race’ is used in legislation, for example in the Public Sector Equality Duty, and the Scottish Government refer to it also in their ‘Race Equality Framework. In statistical publications, the Scottish Government tends to use the term ‘minority ethnic’ to refer to non-white ethnicities. The ONS tends to use the term ‘ethnic minority’, to refer to the same group. We have the term ‘minority ethnic’ for our writing in this article. The term ‘white’ used by the Scottish Government and the ONS refers to the whole of the white population, including those not born in the UK, unless otherwise specified.
Authors

Emma Congreve is Principal Knowledge Exchange Fellow and Deputy Director at the Fraser of Allander Institute. Emma's work at the Institute is focussed on policy analysis, covering a wide range of areas of social and economic policy. Emma is an experienced economist and has previously held roles as a senior economist at the Joseph Rowntree Foundation and as an economic adviser within the Scottish Government.