
This update provides a snapshot of new data on the Scottish economy and households based on data released in the last fortnight.
It has been confirmed that Scotland was in recession in the first half of 2020, and indications for the start of the second half of the year show things improving, but still below pre-Covid baselines in many cases. The impact is different according to sectors and places, with some rural tourism destinations for example seeing a pick up in retail and recreation activities (a theme covered in our recent podcast on the hospitality sector). Support schemes made available, including Eat Out to Help Out and the Coronavirus Job Retention scheme have clearly been popular but we await to see how sectors have benefited from these schemes will fare once they are wound down.
Chart 1: Mobility trends over the pandemic, Scottish average: mobility to retail and recreation has been increasing steadily since the end of June, levelling off in August. Mobility trends for retail and recreation, along with other destinations shown in chart 1 are still below pre-Coronavirus levels.
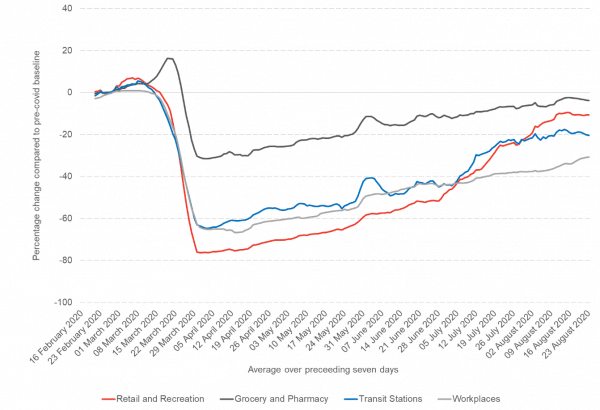
Source: Google Mobility Trends
Note: the Scottish average is based on the data available for 29 out of 32 local authorities. Data is not available for Na h-Eileanan an Iar, Orkney or Shetland.
Chart 2: Trends in Retail and Recreation mobility in the seven days to 23rd August: the trends look very different across local authorities. City local authorities have mobility far below trend, whereas more rural areas are seeing above average mobility. This may reflect demand for tourism related services in these areas.
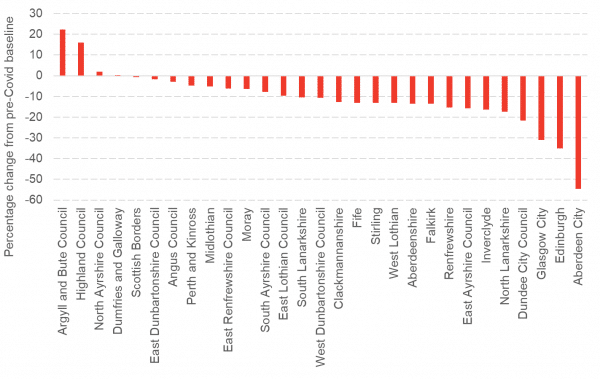
Source: Google Mobility Trends
Note: Data is not available for Na h-Eileanan an Iar, Orkney or Shetland.
Chart 3: UK seated diners: following below trend diner numbers in July these number show that the Eat Out to Help Out scheme, which offers discounting dining on Mondays, Tuesdays and Wednesdays, has had an impact in August
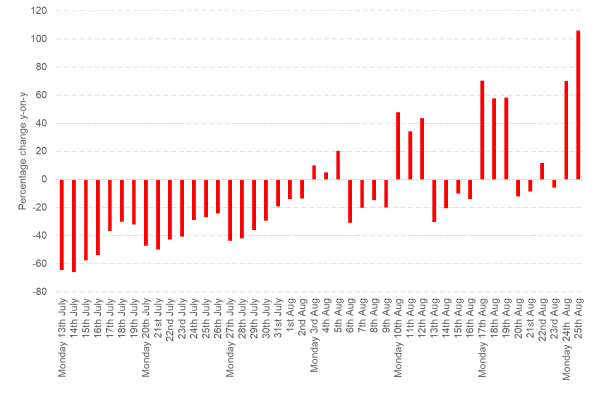
Source: Open Table data across all channels: online reservations, phone reservations and walk-ins
Chart 4: Requests for driving directions in Apple Maps, Scotland: car use according to this source is above levels at the start of 2020 following large falls during the height of the lockdown
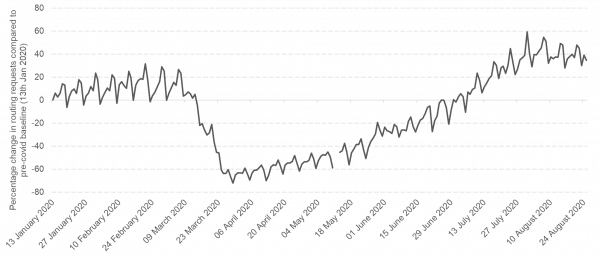
Source: Apple Mobility (note that there is no data for the 10th and 11th May)
Table 1: Answers to the question ‘Which of the following statements best describes your business’s trading status?: Of businesses with Scottish sites that have not permanently stopped trading, over 96% of firms surveyed are now open. The data suggests that for the businesses that remain temporarily closed there is little appetite to start trading in the near future.
| Currently trading and has been for more than the last two weeks | Started trading within the last two weeks after a pause in trading | Paused trading and does not intend to restart in the next two weeks | Paused trading but intends to restart in the next two weeks | Permanently ceased trading ** | |
| Northern Ireland | 91.1% | 3.8% | 4.2% | * | * |
| Scotland | 93.0% | 3.3% | 2.9% | * | * |
| Wales | 95.2% | 2.2% | 1.8% | * | * |
| England | 93.3% | 2.0% | 3.1% | * | * |
| * percentage less than 1% |
| ** These numbers are provided for completeness. Although businesses that reported as having permanently closed in a previous wave are not expected to continue to respond to subsequent waves some have continued to respond as being permanently closed. |
Source: ONS BICS, 27th July to 9th August
Chart 5: Answers to the question ‘In the last two weeks, how has the coronavirus (COVID-19) pandemic affected your business’s turnover, compared to what is normally expected for this time of year?: despite many businesses having reopened, just over half of businesses operating in Scotland reported that they are seeing reduced turnover
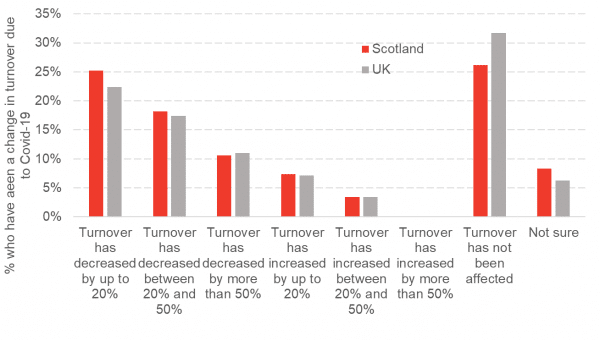
Source: ONS BICS, 27th July to 9th August
Chart 6: Take-up of the Coronavirus Job Retention Scheme (CRJS) by sector, Scotland & UK: the sectors most heavily dependent on the CRJS for the period up to the 31st July are accommodation and food services, construction and the arts and recreation sector. The only noticeable difference between Scotland and the UK average is the higher proportion of jobs furloughed in the construction sector.
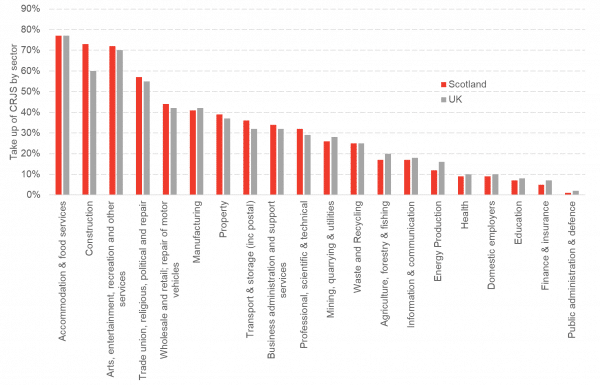
Source: HMRC
Note on our real-term indicators analysis:
We review newly available data each fortnight and provide a regularly updated snapshot of indicators that can provide information on how the economy and household finances are changing. This allows us to monitor changes in advance of official data on the economy being released and also to capture key trends that will be missed by measures such as GDP. Each fortnight we investigate new sources from known data sources and use publicly available data.
Authors
The Fraser of Allander Institute (FAI) is a leading economy research institute based in the Department of Economics at the University of Strathclyde, Glasgow.