Every year when GERS is published, there is a new angle that seems to gain traction and ignite a debate about the accuracy of the figures.
This year’s is a rather misguided interpretation of the notional net fiscal balance produced in GERS.
These have been variations on:
- How can 8% of the UK population be responsible for more than 50% of the deficit?
- And/or how can the Welsh and Scottish deficits add up to more than the UK?
The easiest way to think about this is to consider all 12 areas of the UK together. ONS produces GERS style figures for all 12 “NUTS 1” areas (so Wales, Scotland, Northern Ireland and the 9 regions of England).
The latest ONS figures are for 2017-18, so they are not quite the same as the 2018-19 GERS figures, but it illustrates the key error when pulling together a ratio of the Scottish figure vis-à-vis the UK as a whole.
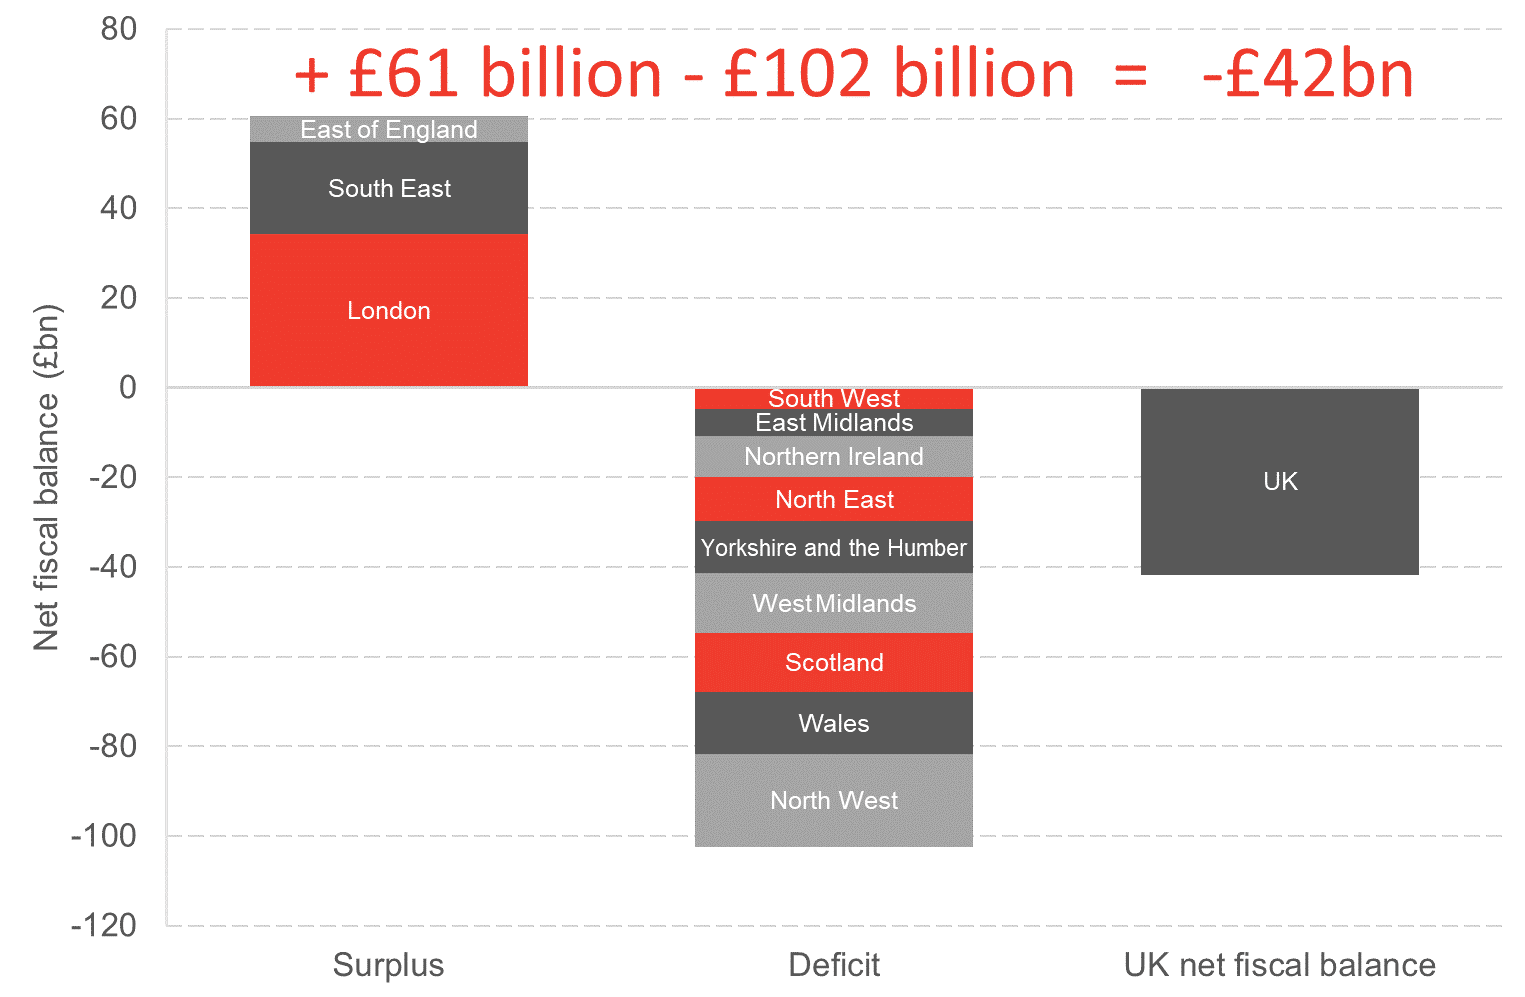
The ONS figures show that:
- 3 areas contribute positively to the UK net fiscal position (that is, they contribute more in taxes than they spend on public services)
- 9 areas contribute negatively to the UK net fiscal position (that is, they contribute less in taxes than they spend on public services).
The UK net fiscal balance is therefore a sum of these surpluses and deficits, as shown below.
Contributions to the UK Net Fiscal Position

Source: ONS
Comparing the £bn figure for Scotland to the equivalent UK figure is simply not a valid comparison. Statements such as “the GERS figures imply that Scotland is responsible for 60% of the UK’s deficit” are just statistically meaningless.
For a more accurate statement about the relative importance of Scotland to the overall UK fiscal position, we could say, on the basis of this ONS 2017-18 data:
- Scotland makes up 13% of the total deficit contributed by the 9 regions of the UK who raise less in taxes than they spend on public services.
Of course, there are important questions about the balance of the UK economy – see our blog on “UK Regional Performance: An increasingly unbalanced picture”. But it’s important to base such discussions on a proper analysis of the data.
A BRIEF ASIDE
Work with us
We regularly work with governments, businesses and the third sector, providing commissioned research and economic advisory services.
Find out more about our economic consulting UK services.
Contributions to the changes in the deficit over time
Another issue that gained traction was the time series of the ratio of the Scottish deficit compared to the UK over time, and in particular since 2011. There were even claims that this was somehow linked to the constitutional debate.
This is not the cause of changes in Scotland’s relative fiscal position.
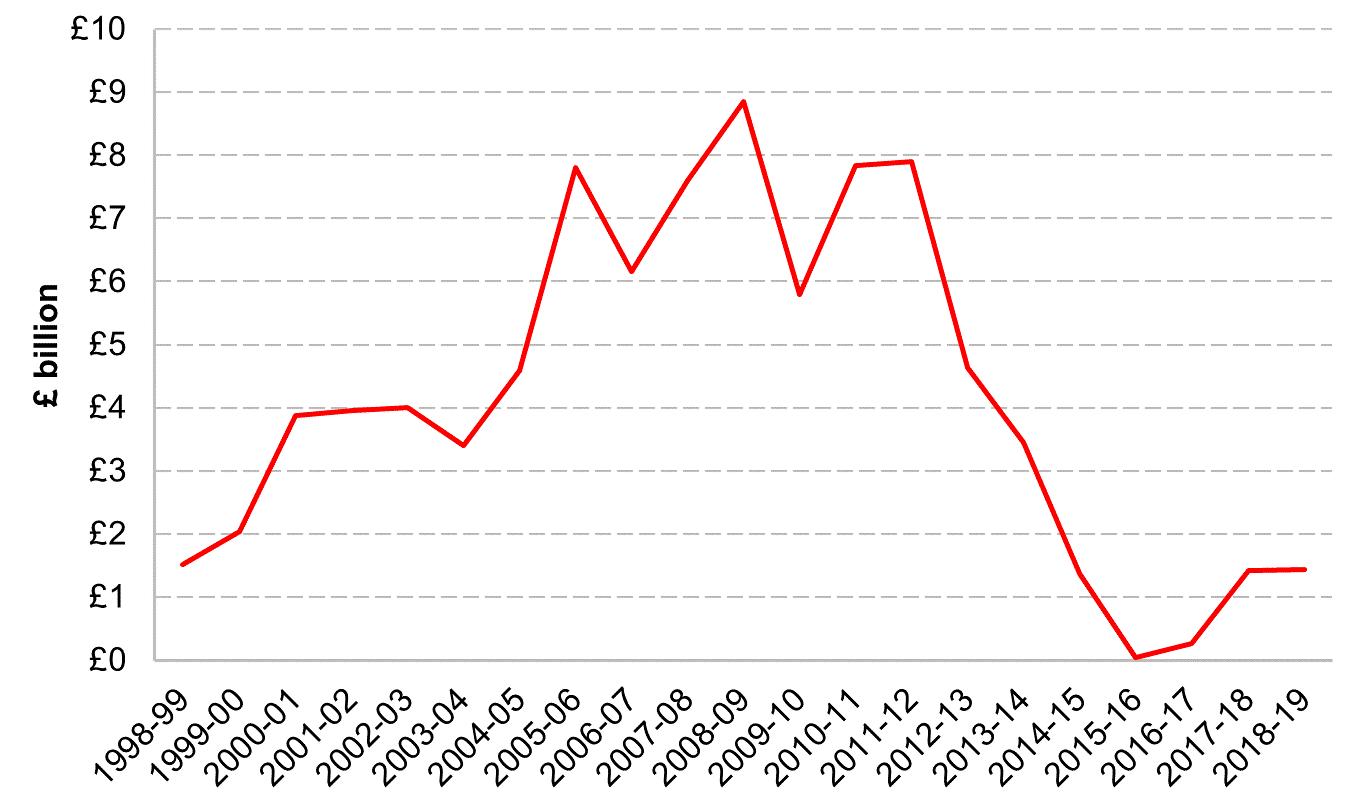
Rather, after 2011 there was a sharp fall in oil revenues – while the oil price itself peaked in 2014, tax revenue was lower in the sector e.g. undertaking investment which incurs tax relief, meant that tax receipts were lower after 2011.
Scottish oil revenues 1998-99 to 2018-19

Source: Scottish Government
Given that oil revenues are now much lower than in earlier years, there is a fairly sustained gap in percentage point terms between the UK and Scottish deficit over time, which is mostly due to higher levels of spending per head.
Final thoughts
As an aside, there is a serious – if albeit boring – point to be made here. Each year, the level of misinformation and bad analysis around the GERS publication is pretty shocking.
This year it was these claims about Scotland’s apparent share of the UK deficit.
The last couple of years it has been that the figures somehow can’t be trusted as they rely, in part, on estimates (although with increasing fiscal devolution substantially less so).
Before then, it was the claim that the publication is a Westminster-exercise (despite the statistics being produced by Scottish Government civil servants – who also provide technical support for Ministers in their policy agenda, including in relation to independence).
We can’t think of any other government statistical publication – and a National Statistics publication at that – that is subject to such criticism and attack.
The Code of Practice for Statistics is clear that organisations producing official statistics should be defending their integrity, actively preventing their misuse and promoting correct interpretation.
Much more could be done by government to defend these statistics and proactively clear-up misunderstandings.
Authors

Graeme Roy
Dean of External Engagement in the College of Social Sciences at Glasgow University and previously director of the Fraser of Allander Institute.
Head of Research at the Fraser of Allander Institute
