
Cost-of-living across the income distribution
Not all households are equally affected by rising prices. New ONS data for the UK released in August divides price indices, expenditure shares, and inflation by income quintile, retirement status, whether or not households have children, and residence type.
As many have anticipated, the households that earn the least are feeling the effects of rising prices most keenly, Chart 1.
Chart 1: Relative CPIH price indices by income quintile, 2005-2022
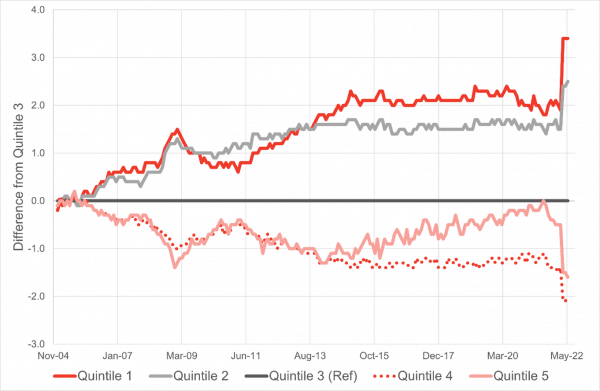
* Indices are differenced from the index for households in the third quintile (the reference group).
Source: ONS
The first quintile (the lowest-earning 20% of households) faced an effective annual inflation rate of 9.8% in June, compared to 9.0% for the middle quintile and 7.9% for the highest.
Resolution Foundation’s forecast estimates that households in the lowest income decile will face inflation of 15% by October, while inflation will be 11% for those in the highest decile.
The difference in price indices across the income distribution are not new, but they have spiked this year. From 2013 to early 2022, the price index for the first quintile was about 2 points higher than for the third quintile. By June 2022, that difference had grown to 3.5 points.
In comparison, the cost-of-living crisis has impacted the highest earners least.
Household spending patterns drive different effective inflation rates across the income distribution. Food, fuel, and housing make up a larger proportion of spending for lower-income households than for higher-income households.
The largest contributors to rising inflation are housing and household services, transport, and food and (non-alcoholic) beverages. The share of expenditures on these categories falls as income increases, Chart 2.
Chart 2: Expenditure shares on selected categories by income quintile, Feb-Dec 2022
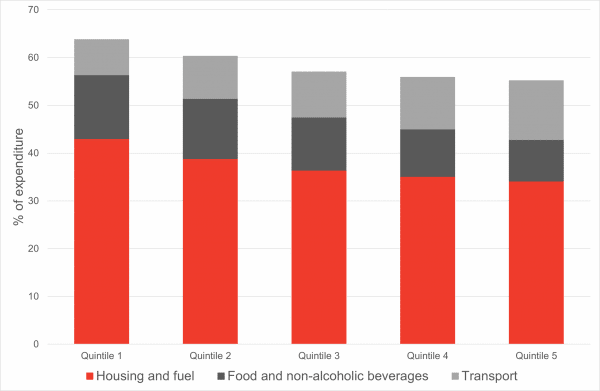
Source: ONS
This year, fuel, food, and transport comprised 64% of the expenditure of the lowest-earning quintile. The highest quintile spends 55% of expenditures on the same categories.
Lower-income households are also more likely to use pre-payment meters, and cannot spread costs across the year. High energy prices are more likely to result in reduced consumption during the winter for these households.
How does inflation affect real incomes?
Price inflation erodes real disposable incomes. In August 2022, the Bank of England estimated that real post-tax incomes will fall by 1.5% in 2022 and by 2.25% in 2023.
In a recent report, the Resolution Foundation concluded that rising inflation will wipe out twenty years of real earnings growth.
These effects are not evenly felt across the earnings distribution.
In addition to facing higher inflation, the lowest-earning households have seen a drop in year-on-year nominal earnings growth this year compared to higher-earning households. This slower wage growth will compound the effects of higher experienced inflation.
Cost-of-living for retired households and households with children
Household composition may also change how households experience changes in the cost of living, also due to differences in the composition of expenditures.
Retired households typically face higher inflation than non-retired households, Chart 3. The inflation rate for retired households has been about 0.4 percentage points (pp) higher than for non-retired households since March. This trend highlights concerns about pensioners rationing fuel this winter.
Chart 3: Inflation by household composition
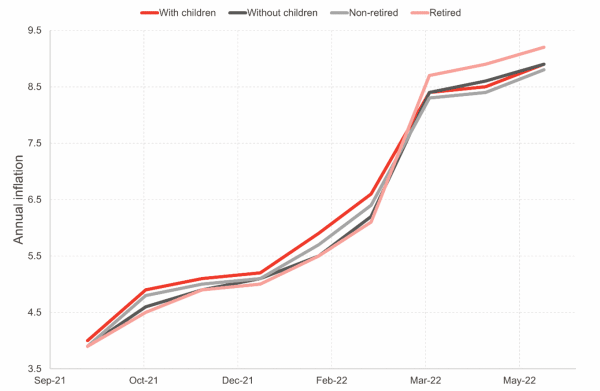
Source: ONS
Unlike retirement status, whether or not a household has children does not materially change the inflation rate they face.
Cost-of-living for renters and homeowners
Housing costs contribute to rising inflation, but the rates faced differ by residency type, Chart 4.
Chart 4: Relative CPIH price indices by resident type
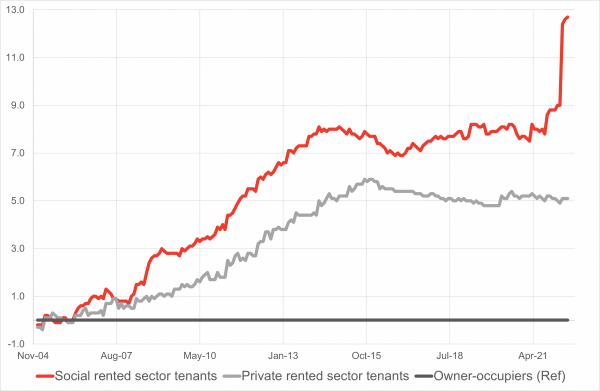
* Indices are differenced from the index for owner-occupier households (the reference group). CPIH indices include housing costs.
Source: ONS
Similarly to price indices across the income distribution, the price index for social rented sector tenants has spiked in 2022 compared to private rented sector tenants and owner-occupiers.
In June 2022, inflation for social rented sector tenants was 11.2%, compared to 8.2% and 8.6% for other renters and owner-occupiers respectively.
The most likely driver of this difference in experienced inflation is food costs rather than housing; social rented sector tenants spend 16.3% of expenditures on food and non-alcoholic beverages. The same share is about 10% for other renters and owner-occupiers.
Subsidised renters spend a smaller share of their expenditures on housing, fuels, and transport, so these are not likely sources of the difference in inflation rates. Regardless, subsidised renters are likely to be relatively low-income, and concerns about reduced food and fuel consumption, particularly in winter, are still salient.
Rising rent and mortgage rates are also likely to exacerbate pressure on household budgets, particularly for new homeowners.
Do proposed policies to combat the cost of living address distributional inequalities?
Both the UK and Scottish governments have announced policies to tackle the cost-of-living crisis, but it remains to be seen if these policies will effectively target those most impacted by inflation.
The £2,500 price cap announced by the UK government in September is guaranteed for two years and applies to all households equally. A £400 discount on energy bills starting in October and the cancellation of green levies on fuel are also universal.
A £15 billion support package announced in May provides one-off payments of £650 to low-income households on certain types of benefits, £300 to pensioner households, and £150 to individuals on disability benefits.
Scottish Government has also recently announced policies that target the most vulnerable households. Initiatives include a rent freeze and a hold on increases to ScotRail fares. The rent freeze in particular may help some in the short-term, but is likely to reduce rental property supply and quality if not carefully implemented.
Some previously-planned policies, such as increasing the Scottish Child Payment from £20 to £25 per week, per child and extending the benefit to under-16s, will also help households with children to manage rising costs.
The full distributional effects of the the cost-of-living crisis and the UK and Scottish governments’ response remain to be seen.
This article is part of our Fraser of Allander Economic Commentary 2022 Q3.
Authors

Hannah is a Fellow at the Fraser of Allander Institute. She specialises in applied social policy analysis with a focus on social security, poverty and inequality, labour supply, and immigration.