Next week, we will be publishing our latest Fraser of Allander Economic Commentary. This will be the first Commentary in association with Deloitte.
In advance of next week’s Commentary, we’ve been looking again at the quarterly growth figures for Q1 in 2017. The results are interesting and offer a surprising insight into what actually drove the strong results reported in the first three months of the year.
Quick Recap
Back in July, the Scottish Government published its initial estimate of GDP growth for the first three months of 2017. The numbers were more positive than predicted and showed a bounce back in the Scottish economy following a challenging 2016.
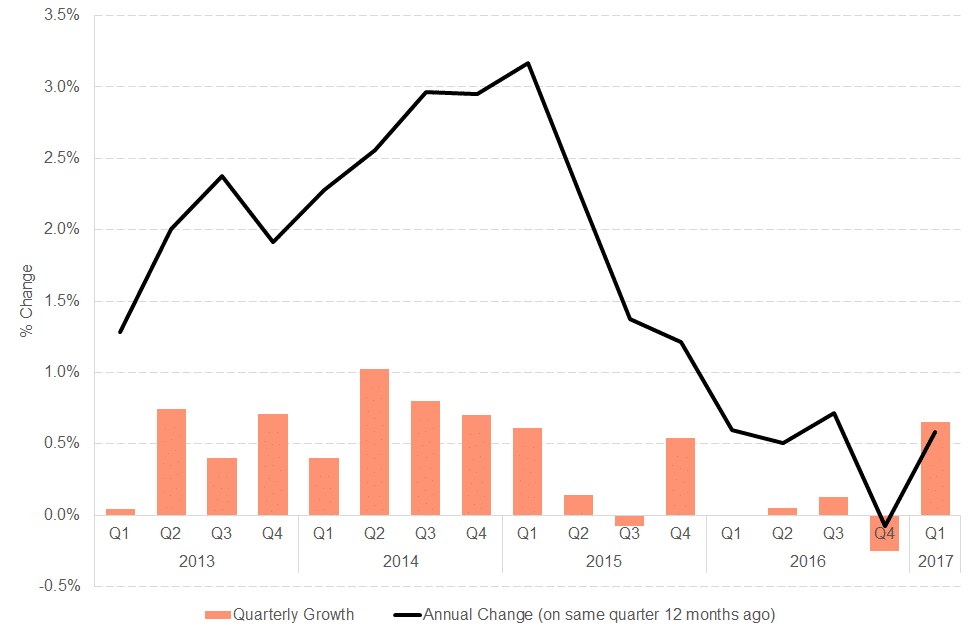
The latest revised estimate shows growth of +0.7% over the three month period (albeit down on the first estimate of 0.8%). This was well ahead of UK growth for the same period of +0.2%.
Scottish economic performance – since 2013

But as the chart highlights, it came on the back of a challenging couple of years – with Scotland close to meeting the technical definition of a recession (two quarters of falling output) in 2016.
Indeed, revised figures published in August show that the economy actually contracted ever so slightly over 2016 – shrinking by 0.1% between Q4 2015 and Q4 2016 – with the closure of Longannet (taking around 0.2% to 0.3% off the headline growth rate) tipping us into negative territory. 4Q-on-4Q growth was +0.4% in 2016.
The upturn in Q1 was driven by production. The sector recorded the third fastest quarterly growth rate – at 2.7% – since the Scottish series was first published in 1998.
Scottish growth (%) by sector, Q1 2017

So what was behind the surge in production?
Newly published (or revised) figures offer some interesting insights.
Sectoral drivers
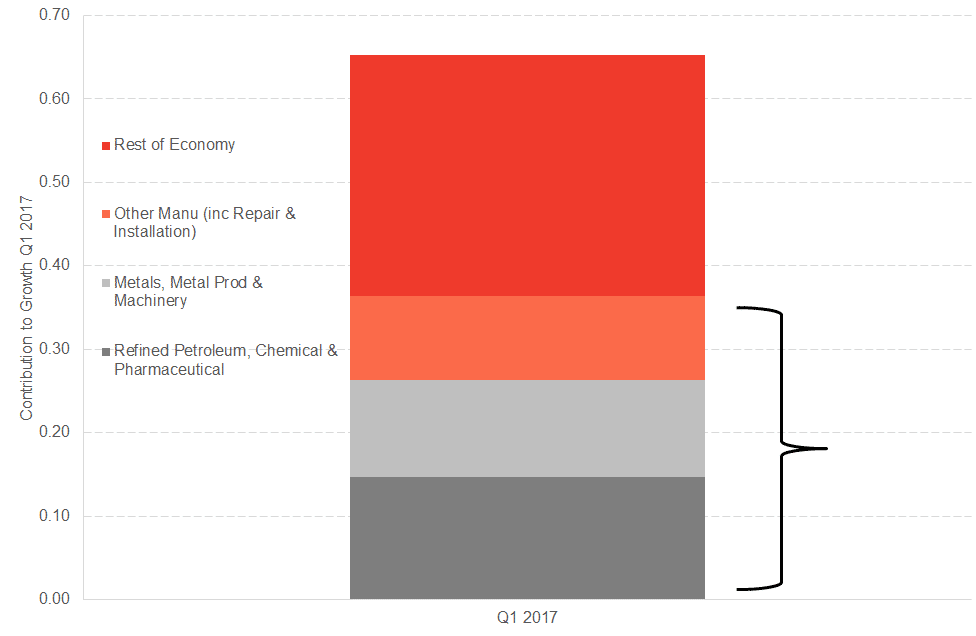
An analysis of the industry make-up of this growth shows that three sectors – ‘metals & machinery’, ‘refined petroleum, chemicals and pharmaceuticals’ and ‘other manufacturing, repair and installation’ contributed around half the net growth recorded in Q1. See chart below.
What is particularly interesting is that, taken together, these sectors account for just 6% of the Scottish economy.
Contribution to Scottish GDP Q1 2017

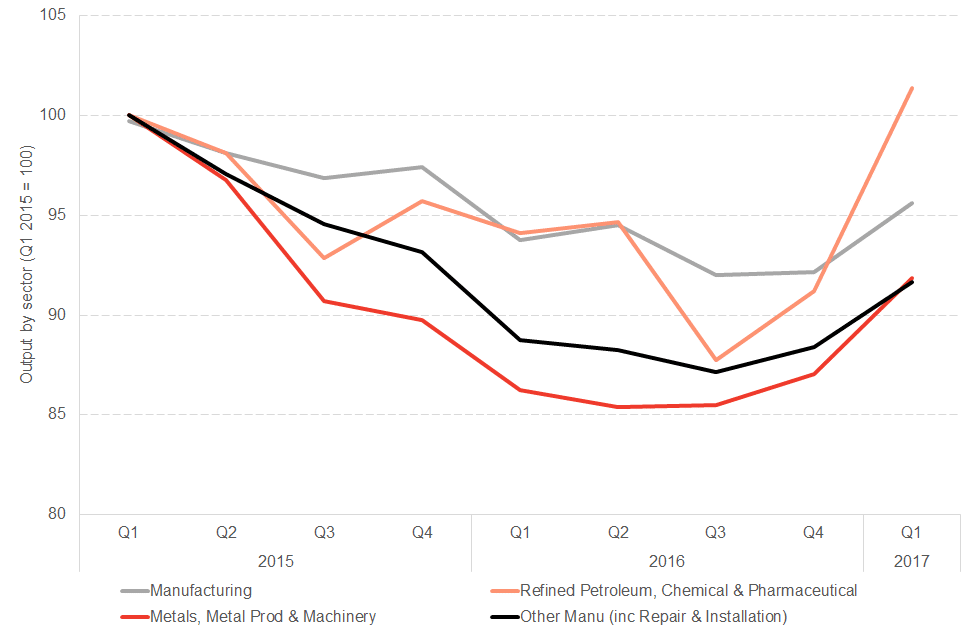
The chart below shows how these sectors have been performing since 2015. All three of them have had a challenging recent history.
Performance by Sector Q1 2015 to Q1 2017

Whilst positive, it is entirely possible that a number of factors which drove the upswing in Q1 will have a (large) temporary impact. A degree of success will be maintaining (and gradually building on) these gains over the next year or so.
The drivers of demand
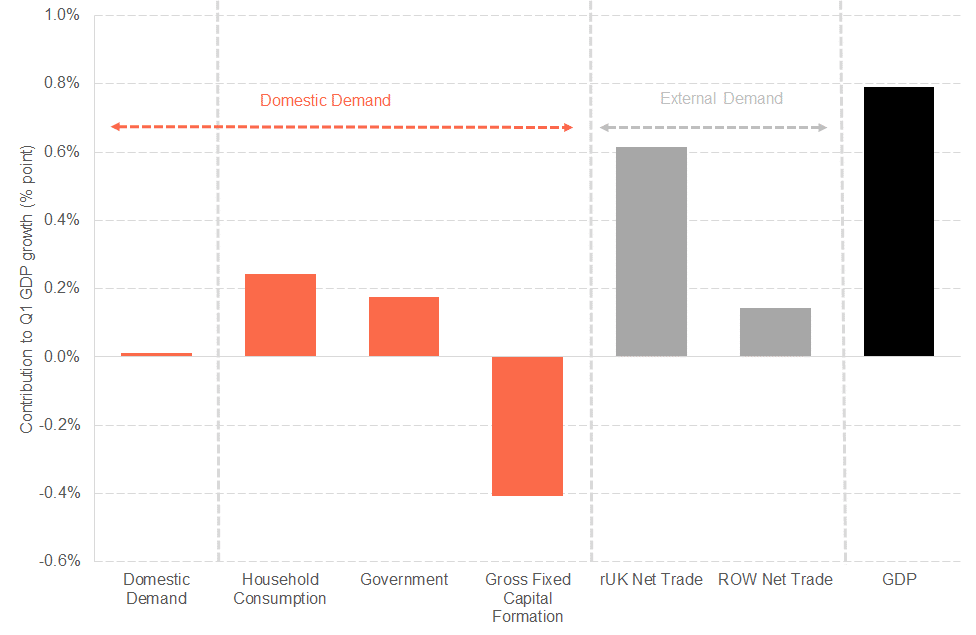
The second interesting feature is that new data published in August shows that the growth in Q1 was driven entirely by external demand.
As the chart below highlights net domestic demand – i.e. demand generated within Scotland – was virtually flat. Growth in household consumption and government spending was cancelled out by a fall in capital spending.
The biggest driver of demand – and the main source of growth – was demand from the rest of the UK (i.e. Scottish rUK exports).
Sources of demand – Q1 2017 – External and domestic demand

Exports to the UK were up 3% over the quarter and – when combined with rUK imports – this added 0.6% points to the total growth of 0.8% witnessed in nominal GDP in Q1 (NB: GDP(E) is presented in nominal terms rather than real terms hence the slightly higher figure of 0.8% vis-à-vis the headline ‘real’ estimate of 0.7%). ROW exports made up the rest.
This is relatively unusual.
Both the sector and demand results suggest that the strong bounce back in Q1 needs to be viewed with some caution.
If the Q1 data do indeed herald a rebound for the Scottish economy from its challenging 2016, there are two things we hope to see when the Q2 data are released.
Firstly we’d expect to see more widespread growth across sectors with the gains made this quarter in manufacturing held on to. Secondly, we should hope to see a pick-up in domestic (i.e. Scottish) demand.
The latest business surveys suggest that growth has continued – although some sectors (e.g. tourism) are faring better than others (e.g. retail). Our latest nowcast suggests that most indicators are pointing toward growth continuing in both Q2 and Q3, albeit slower than for the first quarter of 2017.
Q2 GDP will be published on the 4th October.
Authors
The Fraser of Allander Institute (FAI) is a leading economy research institute based in the Department of Economics at the University of Strathclyde, Glasgow.