
The data deficit
It’s hard to overstate the importance of knowing what’s happening in the labour market. Among other things, it’s essential for compiling key metrics like productivity, understanding changes in living standards, and setting macroeconomic policy. Yet in recent years, our main source of data on the labour market, namely the Labour Force Survey (LFS), has suffered a crisis of confidence.
The central issue has been a decline in the number of people completing the survey, particularly since the pandemic, raising concerns that it no longer provides an accurate representation of the population. The low point came in late 2023, when the LFS lost its accreditation as ‘official statistics’. This situation has hampered our ability to monitor the labour market – and spurred interest in alternative data sources that could fill the gap.
Benefit data is one of these sources. The so-called ‘Claimant Count’, which tallies up the number of people receiving unemployment-related benefits, has long served as a supplementary indicator of labour-market activity. But with the LFS falling out of favour just as the labour market was experiencing the disruptive effects of the Covid-19 pandemic – with the focus shifting to economic inactivity as opposed to unemployment per se – there has been a desire to probe the data further.
For example, in a recent blog, journalist Fraser Nelson highlights an apparently precipitous increase in ‘out-of-work benefits’ across Great Britain since 2020. He focuses particularly on incapacity-related (what he calls ‘sickness’) benefits – those awarded when an individual is deemed unable to work – and the associated fiscal costs. For Nelson, this reflects a range of problems with the benefit system, which encourage people to claim benefits when they could be working.
The benefit data is reliable: whereas surveys like the LFS are subject to sampling issues, these data are simply an administrative record, with some minor adjustments and revisions. But interpreting the data is another matter. The correspondence between receipt of benefits and labour-market status is not only imperfect, but changeable, undermining any quick conclusions that might be drawn from the headline figures.
A moving picture
DWP do publish a measure which they call ‘out-of-work’ benefits, which has indeed been rising sharply since the Covid-19 pandemic. But this is something of a misnomer, since the measure will include a significant proportion of people who are, in fact, in work. What is more, this proportion has likely increased over time.
The recent increase in the out-of-work measure is comprised entirely of claims to Universal Credit (UC), which has been gradually replacing a set of six ‘legacy benefits’ since 2013. The distinction between in-work and out-of-work benefits was not entirely clearcut even in the legacy system, but carries even less meaning in the context of UC. This is by design; in fact it reflects an intention to ensure precisely that people are encouraged to work.
Under the legacy system, the distinction between in-work benefits and out-of-work benefits was mainly drawn on the basis of working hours, with those working 16 hours per week or more directed to Working Tax Credit (WTC) rather than ‘out-of-work’ benefits like Jobseekers Allowance or Income Support. By contrast, under UC, all claimants are placed into one of six ‘conditionality regimes’, which codify the degree to which DWP require claimants to work or search for work based on factors such as their childcare responsibilities and health status. Four of these regimes are included in the out-of-work measure because they indicate either that the claimant has no work-related requirements, or that they do have work-related requirements and are not earning enough for those requirements to be relaxed.
But all of these regimes will include some people who are in fact in work, including many low-earners and self-employed workers as well as all working claimants who are responsible for a baby, have a limiting health condition, or are exempt from conditionality for other reasons. As some of these workers would have previously received WTC – or potentially been ineligible for legacy benefits altogether, for example on the basis of their household income – the proportion of claimants in the out-of-work measure who are actually in work has likely increased as UC has been rolled out.
The data themselves do not allow us to quantify this effect precisely, but from what we can tell it seems to be significant: the proportion of claimants who are in work seems to have been much greater in the UC ‘out-of-work’ groups than it has been in legacy ‘out-of-work’ benefits, although this observation is based on comparing across data sources and should therefore be treated with caution.
Percentage of claimants receiving legacy out-of-work benefits or in Universal Credit out-of-work conditionality regimes who are in employment, Great Britain
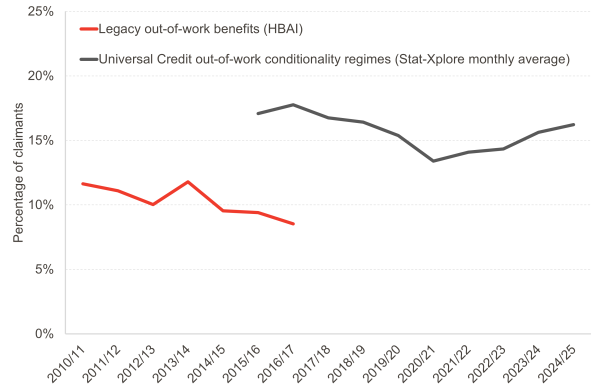
Notes: legacy out-of-work benefits include Jobseekers Allowance, Income Support, Incapacity Benefit, Pension Credit, and Employment and Support Allowance and are restricted to working age; UC out-of-work conditionality regimes include Searching for Work, Planning for Work, Preparing for Work, and No Work Requirements; data on UC conditionality not available before April 2015; sample sizes of legacy benefits too small after 2016/17; employment status and UC conditionality regime determined at different intervals; both measures restricted to working-age, exclude self-employment, at GB level
Sources: DWP, Households Below Average Income (HBAI) and DWP, Stat-Xplore
A version of this problem has also affected the Claimant Count, leading the ONS to develop an ‘Alternative Claimant Count’ that attempted to adjust for the UC transition. But whereas the Claimant Count is an indicator of unemployment specifically, the out-of-work measure is broader in that it is also meant to capture those who are not searching for work. Much of the focus since the pandemic has been on this ‘economically inactive’ group as opposed to those who are unemployed per se.
With that said, recent changes to UC may have magnified the ‘UC effect’ specifically for those who are searching for work (or, rather, those who are expected to be). The earnings threshold that determines the conditionality regime of many claimants has been repeatedly increased since 2022, with the effect that more low earners will have been placed in the ‘Searching for Work’ group. This appears to be borne out in the data.
Percentage of claimants in Searching for Work regime who are in employment, Great Britain
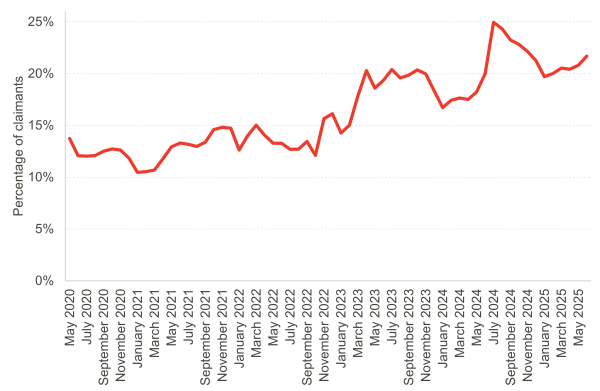
Notes: employment status and UC conditionality regime determined at different intervals; excludes self-employment
Source: DWP, Stat-Xplore
After the roll-out of UC is complete – currently planned for March 2026, with tax credits having already ended in April this year – the statistics will at least be consistent over time. But by the same token, the very notion of out-of-work benefits, while always a simplification, is now becoming an anachronism. Conclusion: using the benefit data to make judgements about the labour market is risky business.
Digging deeper
We might try to avoid these issues by focusing on incapacity-related benefits. Not only are these benefits awarded specifically to claimants who are deemed unable to work, but the same assessment (namely the Work Capability Assessment [WCA]) has been used under both the health element of UC and the main legacy benefit it is replacing (namely Employment and Support Allowance [ESA]). So in theory, aggregating these benefits should provide a consistent picture – and the picture seems to confirm a steady increase in caseload since the pandemic.
Number of working-age claimants receiving legacy incapacity benefits or Health Element of Universal Credit, Great Britain
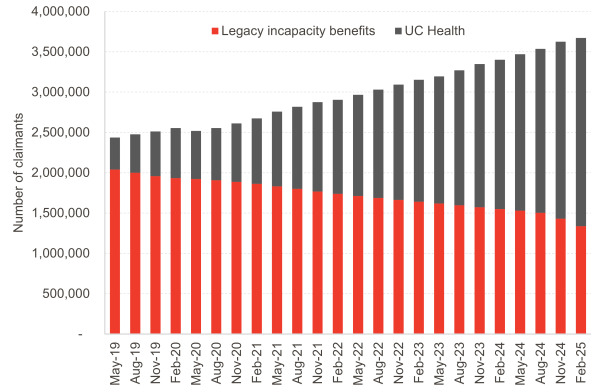
Notes: Legacy incapacity benefits comprise Employment and Support Allowance plus a small number of cases of Incapacity Benefit; the small number of claimants counted as receiving both sets of benefits are grouped with legacy benefits.
Source: DWP, Stat-Xplore
Alas, the reality is not so simple. For one thing, although UC Health does not require claimants to work or search for work, nor does it forbid them from doing so. ESA, on the other hand, was more closely tied to work status, with strict limits to working hours and earnings as well as more rigid rules around household income. It therefore seems likely that the same issue affecting the out-of-work measure as a whole – namely, that the UC components contain a higher proportion of people in work than the legacy components, affecting the total caseload as UC is rolled out – also affects incapacity-related benefits.
To complicate matters further, the UK Government has plans to replace the WCA with the assessment that is used for disability benefits, which is meant to evaluate whether an applicant requires additional living expenses as opposed to whether they can work. Again, the intention is to encourage work by (further) delinking it from the benefit system. This will not only introduce a structural break in the data, but will make the very idea of incapacity benefits obsolete.
This is not to say that nothing can be gleaned from the data. Confounding factors like the UC roll-out will cancel out when making comparisons between groups to the extent that those factors are experienced equally. To the extent that they are not, their influence can be explicitly considered.
To take an example, we can see that over 15% of the working-age population is receiving incapacity-related benefits in Inverclyde, West Dumbartonshire, and North Ayrshire – around twice the proportion that we see in places like Edinburgh, East Dunbartonshire, and Aberdeenshire. Granted, there is some indication that the UC rollout has proceeded more slowly in the latter regions, where UC Health generally represents a slightly lower proportion of the total incapacity-related caseload. But such differences do not seem sufficient to fully explain the overall pattern – and may well reflect some of the same underlying causes.
Percentage of working-age population receiving incapacity-related benefits by Scottish local authority, February 2025
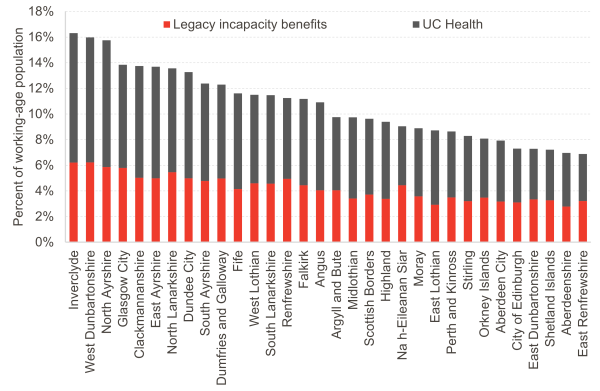
Notes: legacy incapacity benefits include Employment and Support Allowance plus a small number of cases of Incapacity Benefit; numerator is for March 2025, denominator is mid-year estimate for 2024
Source: DWP, Stat-Xplore and NRS, mid-year population estimates
Indeed, just because there are analytical pitfalls does not mean that the overall increase in incapacity-related benefits is entirely down to a ‘UC effect’ – only that this is a confounding factor. Disability benefits, which are not affected by the UC roll-out, have risen even faster than incapacity-related benefits over the past five years. This implies that there are underlying factors at play, although the overlap between the two sets of benefits is only partial.
Change in working-age disability and incapacity-related benefit caseloads, Great Britain, May 2019 = 100
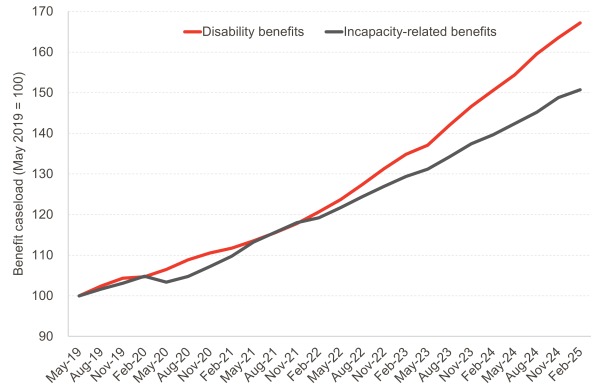
Notes: disability benefits include working-age Disability Living Allowance, Personal Independence Payment, and Adult Disability Payment; incapacity benefits include Employment and Support Allowance, Incapacity Benefit, and Universal Credit Health
Source: DWP, Stat-Xplore and Social Security Scotland
Questions – and more questions
Benefit data can tell us a lot, but ultimately it depends on what we want to know. As a guide to the labour market, they are a poor substitute for dedicated data sources – particularly if we are interested in changes over time. Even in the absence of such sources – at least reliable ones – we are still better off consulting information that is more directly related to the labour market. Modelling based on administrative tax data indicates that employment rates have recovered to their pre-Covid levels, belying not only the results of the LFS but also the impression given by the ‘out-of-work’ benefit caseload.
With that said, the steep rise in incapacity-related benefits seems to be a real phenomenon, even if it is partially confounded by the rollout of UC. But what this means for the labour market is not altogether clear – nor are the underlying causes. The OBR, for one, offer a range of possible explanations, including not only issues in the benefit system but also economic pressures, demographic change and shifts in population health. It seems that the data raise as many questions as they answer.
Authors

Senior Knowledge Exchange Fellow