
It has been well documented in recent years that a large proportion of households in poverty in the UK contain one or more people in employment. The rise in so-called ‘in-work poverty’ has received widespread attention in research and policy analysis (e.g. Bourquin et al. 2019).
At the same time there has also been concern about ‘underemployment’ (e.g. Bell & Blanchflower 2013, 2018). The underemployed are those who would like to work longer hours at their current rates of pay.
But what is the relationship between underemployment and poverty? Are workers living in poverty more likely to be underemployed than those who are not? And what proportion of the underemployed in the UK live in households in poverty?
Answering these questions is tricky. The reason is that the main surveys of household income in the UK (primarily the Family Resources Survey (FRS) but also Understanding Society) do not ask respondents about underemployment. And the Labour Force Survey (LFS), which does ask respondents about underemployment, does not include sufficient information on household income to be able to infer the household income status of its respondents.
In this blog we describe a method that we have used to shed light on the relationship between poverty and underemployment. The method involves ‘matching’ individuals in the FRS with quantitatively similar individuals in the LFS, in order to examine the distribution of underemployment across the household income distribution.
The work was undertaken as part of our ongoing project examining patterns in working hours in the UK, funded by the Standard Life Foundation.
How is underemployment defined, and what might affect it?
We adopt the definition of underemployment used by the ONS.[1] Specifically, the underemployment are those who are either:
- Looking for an additional job
- Seeking a new job with longer hours than their current job
- Seeking longer hours in the current job at the same basic rate of pay.
Moreover, to be classified as underemployed, an individual must be available to start working longer hours within the next two weeks, and must be working less than 48 hours per week currently (or less than 40 hours per week if aged under 18).
Our forthcoming analysis for Standard Life Foundation shows that the underemployed are consistently more likely to be young, working in low-paid jobs, and be less well qualified than those who are not underemployed. Those working on zero hours or temporary contracts are more likely to be underemployed than those who are not, even after controlling for the lower pay and lower hours worked in these types of job on average.
But how are underemployed workers distributed across the household income distribution?
Data-matching – the approach
To try and understand this, we undertook a data-matching exercise to match employees in the LFS to equivalent employees in the FRS. We were able to use this data-matching approach and exploit the fact that the two surveys overlap significantly in the information they collect on individuals (although only the LFS collects data on underemployment, and only the FRS collects data on household level income factors).
Simply put, for each individual in the FRS, matching involved finding the individual most similar to them in the LFS. To define similarity, we used the following characteristics:
- age [13 categories]
- hourly wage [10]
- whether they are married/cohabiting versus not [2]
- gender [2]
- whether they have dependent children [2]
- major occupation class [9]
- banded usual weekly hours of work [4]
- whether or not they have a degree [2]
Using the overlapping information in the two datasets in this way allowed us to, for example, match two 35 year old, single females with a degree and no dependent children who are senior managers on roughly the same hours of work and wage, one of whom was in the LFS and the other who was in FRS.
Given these two individuals are observationally identical, we then assume that if the LFS individual is underemployed her FRS counterpart will also be underemployed. This assumption is important: for those in the FRS we are estimating whether or not they are underemployed, based on the set of variables above. We discuss caveats to this approach further below.
Overall, we successfully matched 95.9% of employees in the FRS to a similar individual in the LFS. The resulting (nationally weighted) underemployment rate among those matched from the FRS is 6.8%, compared with a higher rate among employees in the LFS of 7.8% between January and March of 2019.
Underemployment is higher amongst employees living in poverty
With an underemployment outcome “donated” to those in the FRS, we compared underemployment levels across the household income distribution.
Figure 1 shows the proportion of individuals in each decile of the household distribution we estimate to be underemployed, and overlays an approximate poverty line. There is a clear downward trend across the distribution, with those in higher income households estimated to be far less likely to be underemployed than those at the bottom of the income distribution. The resulting underemployment rate among employees in living in households in poverty (to the left of the red line) is 11%, compared to 6.5% amongst those not living in poverty.
Figure 1 – Estimated underemployment across the household income distribution
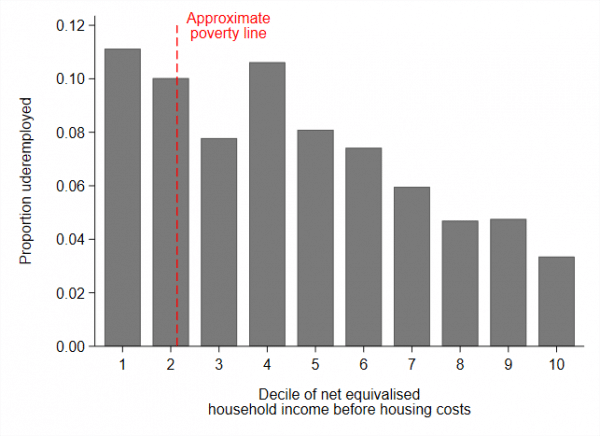
Source: LFS, FRS, and author calculations
Higher underemployment rates among lower income households are not in themselves particularly surprising. They can, be explained by the fact that employees in low-income households are more likely to be employed in less well paid or part-time jobs – which are themselves key factors determining the likelihood of underemployment at an individual level. The work on which this blog is based shows both of these relationships exist in the UK.
But the majority of the underemployed do not live in poverty
However, despite the fact that the likelihood of a worker being underemployed is higher amongst lower income households, underemployment is certainly not just a problem observed in low income households, or amongst households in poverty. In fact, we estimate that of all underemployed employees, a large share of them are concentred in the middle of the household income distribution. Just 10% of all underemployed employees are found in households in income poverty (Chart 2).
This finding of course reflects both the fact that that there are more individuals in work in households higher up the income distribution, and that there are large numbers of low-paid and/or low hours employees in households not in poverty. This is similar to one explanation for why a rise in the minimum wage – whilst it might reduce earnings inequality amongst employees – tends not to reduce household income inequality or in-work poverty (Joyce and Waters, 2019).
Figure 2 – The share of the underemployed in each household income decile
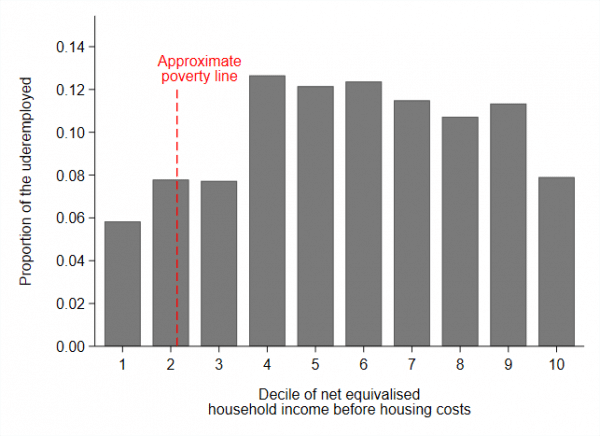
Source: LFS, FRS, and author calculations
Conclusion
Matching individuals across the LFS and FRS allowed us to descriptively analyse underemployment across household income levels – a piece of analysis we otherwise would have not been able to carry out using the two datasets in isolation.
Our two key takeaways are:
- The underemployment rate is higher amongst employees in households in poverty than it is amongst employees in households not in poverty;
- But underemployment is certainly not just an issue experienced by those in poverty – the majority of underemployed employees do not live in poverty.
The first finding reflects the fact that workers in-poverty are more likely to work in low-paid and/or part-time work. The second finding reflects the fact there are many individuals working in low-paid and/or part-time work who do not live in a household below the poverty line.
Our results are predicated on an assumption that the distribution of underemployment across households by income can be approximated by the characteristics we set out above. These do include some household level characteristics (marital status and children), but don’t explicitly take account of household income other than through the earnings of the individual. A limitation therefore is that our matching does not explicitly capture the fact that the likelihood of underemployment for a given individual may be influenced by the income of other members of their household. However, it is unlikely that this type of “error” has systematically biased our results, but rather adds to the uncertainty around them.
Future work could usefully explore the importance of household level factors in determining individual underemployment status.
Notes
[1] The measure of underemployment we use here should not be confused with skills underutilisation, which is sometimes also referred to as underemployment.
Authors

Mark Mitchell
Mark Mitchell is a former research associate at the FAI. In 2021, Mark moved to a post in the Competition and Markets Authority. His research area is applied labour economics, focussing on the causes and effects of human capital accumulation over the lifecourse.

David Eiser
David is Senior Knowledge Exchange Fellow at the Fraser of Allander Institute

Graeme Roy
Graeme is Professor of Economics at the University of Glasgow, and formerly Director of the Fraser of Allander Institute