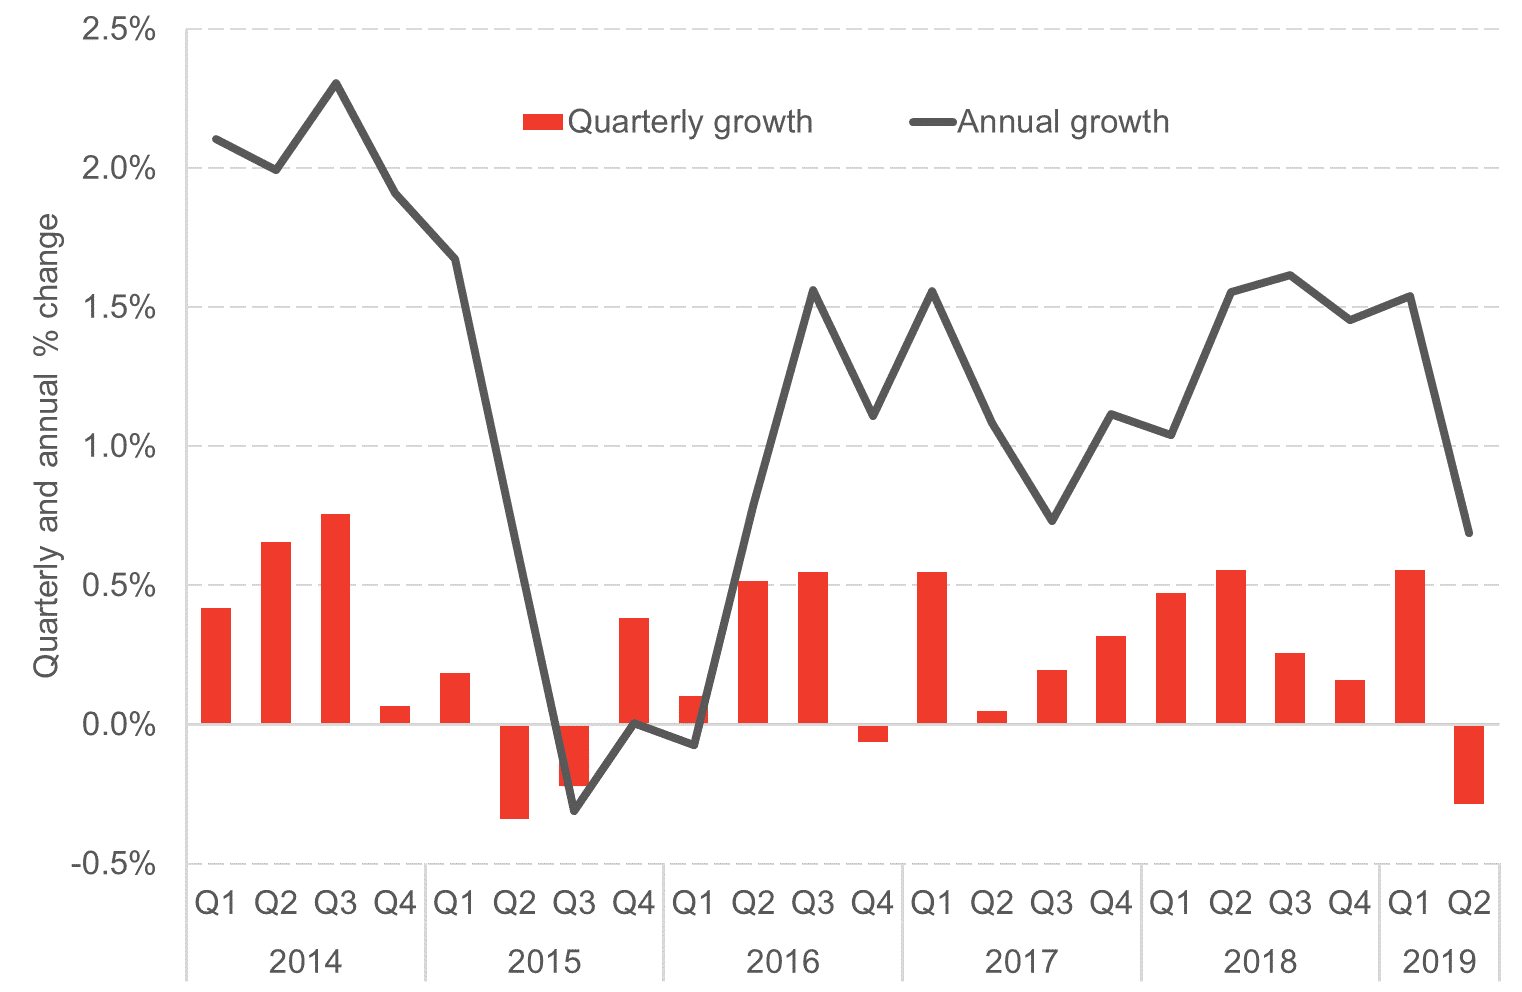
Today, the Scottish Government published their growth estimates for the second quarter of 2019 – with the results suggesting that the Scottish economy contracted by -0.3% in Q2 2019.
These estimates broadly mirror the trends we’ve seen at the UK level, where over the same period, UK output contracted by -0.2%.
Recall that today’s figures come on the back of strong growth in Q1 of this year. Over the first three months of 2019, the Scottish economy grew by +0.6%.
As we argued back then, movements in Scottish GDP data have been impacted by the stockpiling that has been taking place as a result of Brexit.
Uncertainty surrounding a no-deal Brexit back in March led many firms to build up their supplies, leading to a boost in GDP in Q1. As the deadline of the UK’s departure from EU moved forward to October, and immediate no-deal panic preparations calmed, firms have since unwound these preparations leading to GDP in Q2 slipping back.
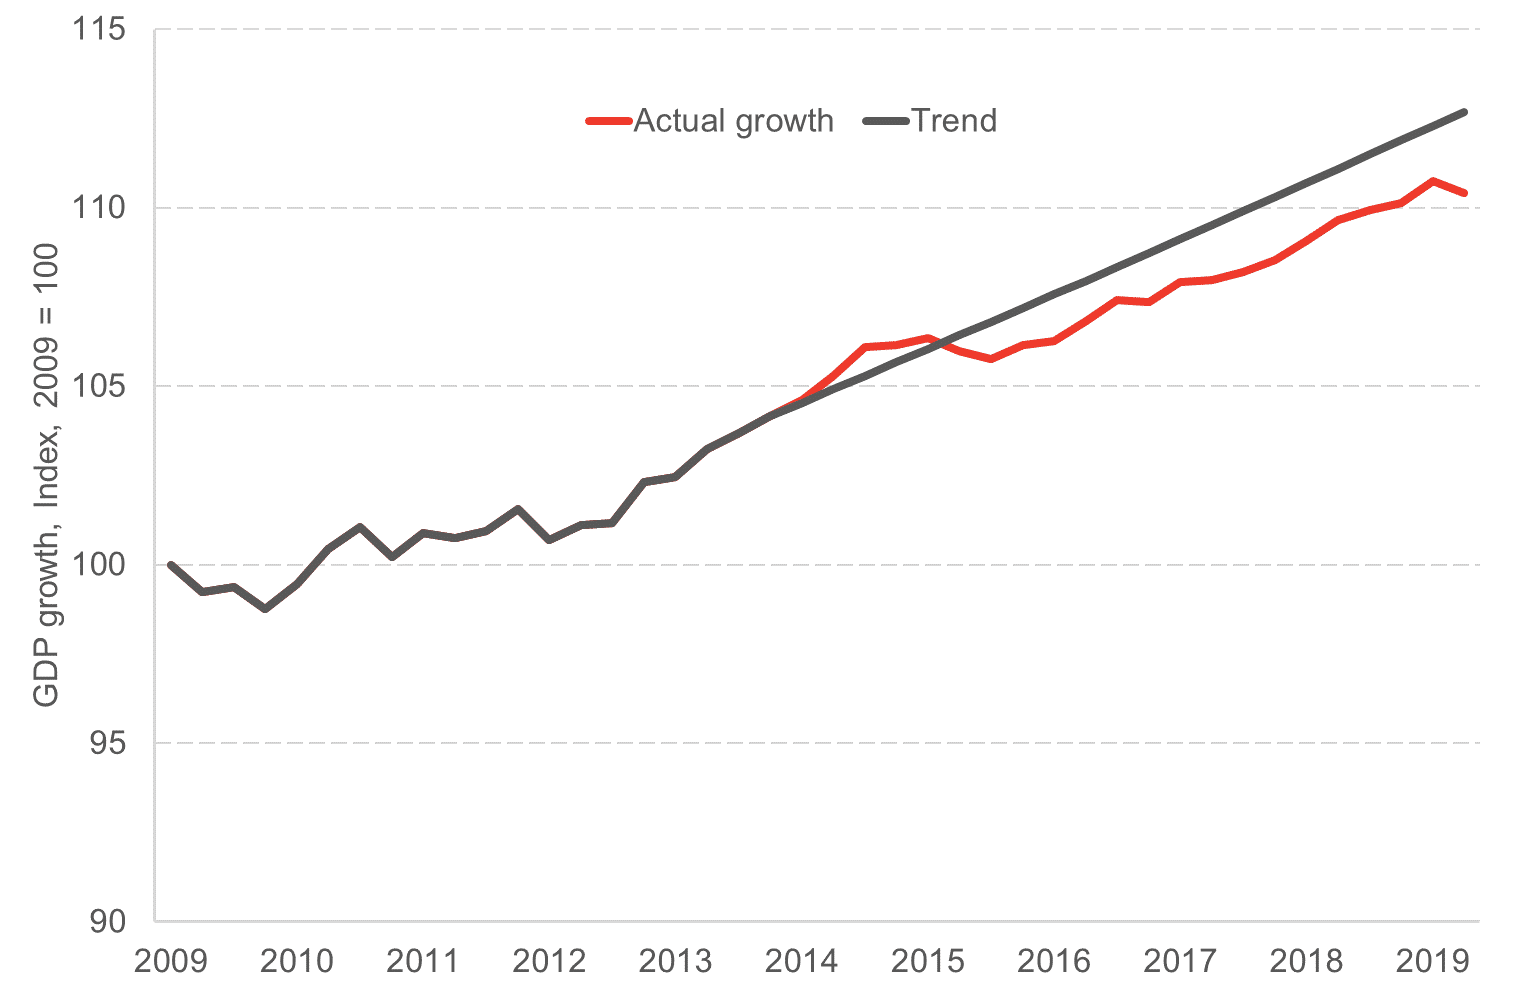
Two immediate reflections. Firstly, it is important in these times to focus upon longer-term trends and not the volatile quarter-to-quarter changes. Here again, we see Scottish growth remaining fragile and well below trend.
Secondly, we’ve seen emerging UK data suggest that activity has picked up over the summer months. This suggests that the likelihood of a technical recession over Q2 and Q3 of 2019 – i.e. two consecutive quarters of negative GDP growth – remains relatively small (but not impossible).
Latest figures
Today’s numbers show a contraction in the Scottish economy of -0.3% in second quarter of this year.
Growth for the year to Q2 2019 is +0.7%. As has been a trend in recent times, Scotland has been growing more slowly than the UK as a whole. UK annual growth to Q2 2019 is 1.2%.
On a per capita basis, stripping out the role that population changes plays in determining overall GDP, growth in Scotland over the year was just 0.1%. Equivalent UK growth was 0.6%.
Annual growth – either on an aggregate or per capita basis – remains well below Scotland’s long-term trend growth.
The following chart highlights the growth of the Scottish economy since 2014.
Scottish economic growth, Q1 2014 – Q2 2019
Source: Scottish Government
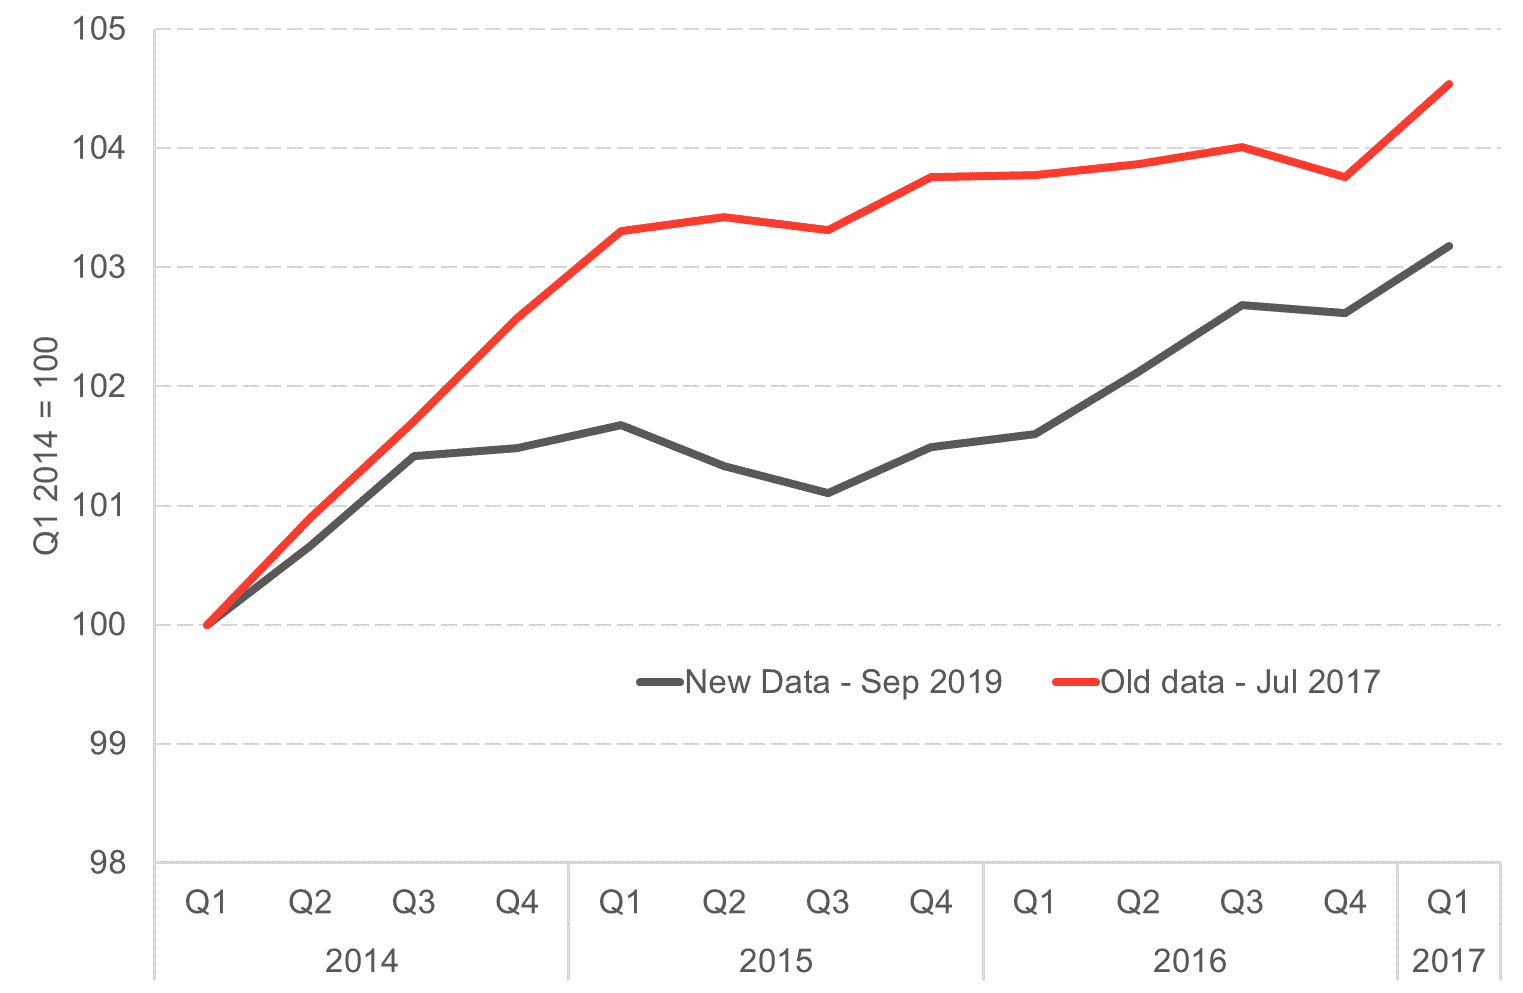
One interesting development is that Scotland is now thought to have been in a not-insignificant recession in mid-2015.
Between Q1 and Q3 2015, the Scottish economy contracted by 0.6% (with a fall of 0.3% in Q2 and 0.2% in Q3). Recall that this was at the height of the downturn in the oil and gas sector. However, the initial estimates published by the Scottish Government were for growth of 0.1% in both quarters.
The annual growth revisions are just as large. Two years ago, the statistics were pointing to growth of over 2% in 2015 but today’s figures suggest growth was just a quarter of that (at 0.5%). During this time, and in the couple of years afterwards, we were highlighting how weak the Scottish economy appeared to be performing (and were criticised by some for doing so). Today’s data highlights that this assessment was correct.
Scottish GDP growth with the latest data and estimates from July 2017, Q1 2014 – Q1 2017
Source: Scottish Government
Such revisions are part-and-parcel of the publication of economic statistics, and are important in ensuring that as better data become available we revise our understanding of economic performance. But these revisions are relatively large. Little has been said in the accompanying statistical releases to explain them.
The following chart shows Scotland’s performance in recent years against its long-term trend.
Scotland, between 1998 and the end of 2013, grew at an average quarterly rate of around 0.4%. We applied this long-term growth rate to GDP from 2014 onwards to get our trend line.
Scotland’s average quarterly growth rate since 2014 has been around 0.3%. 0.1 percentage points below trend.
Scottish GDP growth, actual and long-term trend, 2009 – 2019
Source: Scottish Government
Sector growth
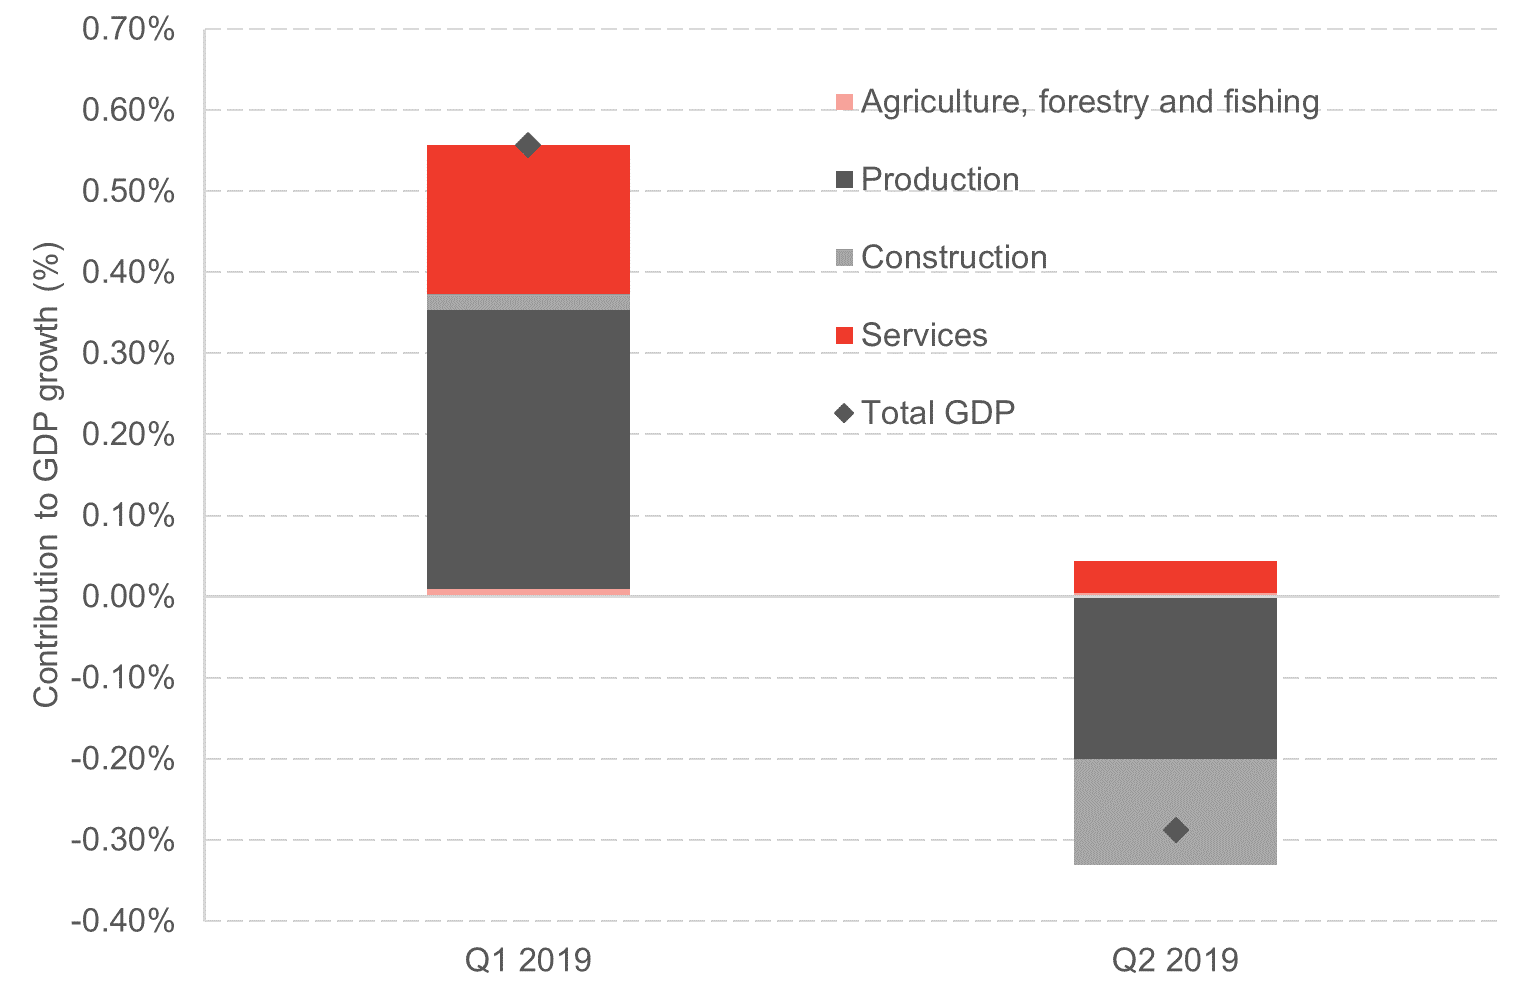
Turning to the sectoral composition of this quarter’s growth, the Services sector appear to be the only major sector making a positive contribution to growth. Production, construction and agriculture all saw activity drop.
The volatile nature of the data is clear from the chart below.
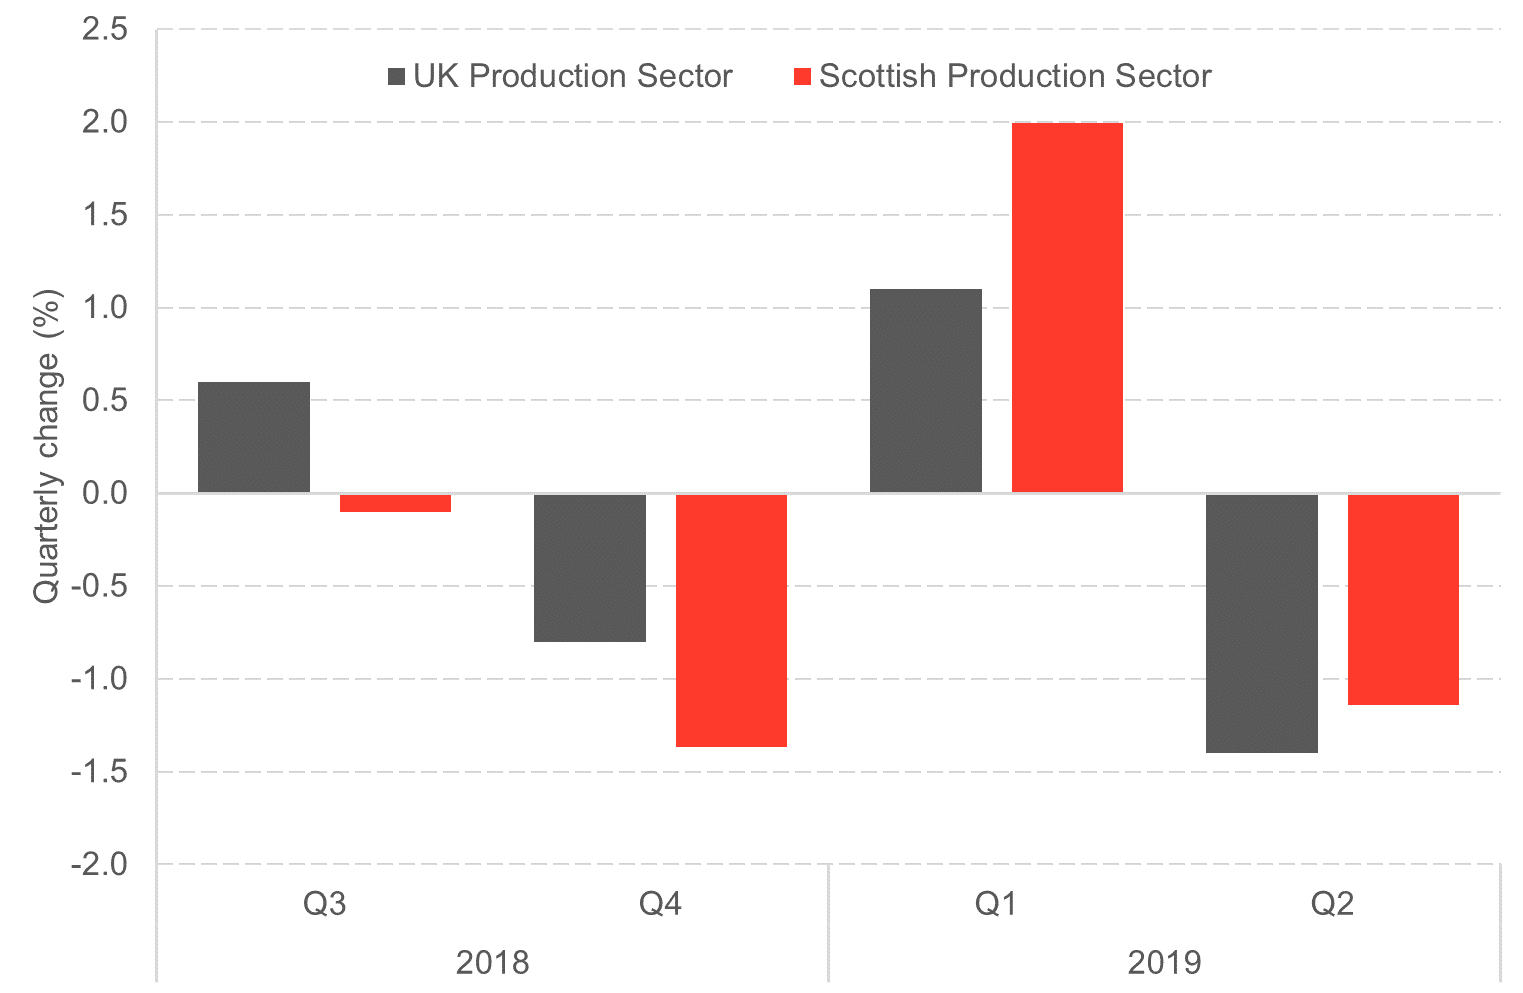
In Q1, construction and production both made a positive contribution to GDP growth. Indeed, over half of the pickup in the entire economy came from production (a sector that comprises just 17% of the Scottish economy).
This quarter, Scottish growth was dragged down by a large contraction in production.
Composition of economic growth in Scotland over Q2 2019 and Q1 2019
Source: Scottish Government
The volatility in the data is clearly evident from the quarterly behaviour of the production sector over the last year – see Chart.
Scottish and UK production sector growth over last year
Source: Scottish Government
This is no more evident than in manufacturing, which grew by 2.3% in Q1 but then shrank by 2.5% in Q2!
The impact of stockpiling
It is clear that much of these trends have arisen from firms stockpiling supplies in the event that the UK exited the EU at the end of March. Firms involved in the production sector – particularly manufacturing – are much more likely to stockpile supplies (both for their own inputs and their final products).
In our work for ESCoE we have shown how such effects have been replicated right across the UK. See for example this blog which contains estimates for the regions and nations of the UK in 2019 Q2.
So one of the key takeaways from this period of heightened uncertainty is that while activity was boosted in Q1 as firms stockpiled, activity was depressed in Q2 as firms unwound these stocks. In this sense there is an offsetting effect to (some, if perhaps not all of) this sort of activity.
This means that comparisons on economic performance now to a year ago, or across the UK, might provide a more meaningful basis to compare economic performance than the effect of quarter on quarter fluctuations.
Is a recession on the cards?
The volatility in the date is likely to reflect temporary factors which won’t persist into Q3.
As the table below shows, activity in the UK economy has picked up in recent months.
Whilst fragile, this suggests that a technical recession in the next quarter – i.e. two consecutive quarters of falling output – appears unlikely.
Of course, all this could change if the Brexit process was to further unravel.
UK economic growth, May 2019 – July 2019
Next week we will be publishing our latest Scottish Business Monitor for Q3 2019 in association with our new sponsor Addleshaw Goddard. This will give an updated assessment of activity in the Scottish economy via our quarterly survey of over 500 businesses in Scotland. The survey covered the months August and September so will give a crucial insight into whether today’s contraction in GDP has had a lasting impact on businesses in Scotland.
Authors
The Fraser of Allander Institute (FAI) is a leading economy research institute based in the Department of Economics at the University of Strathclyde, Glasgow.