New labour market data were released this morning showing that the Scottish unemployment rate (16+) is now 4.1%, and the employment rate (16-64) is now 74.3%.
This means that there has been an increase in unemployment of 0.8%-points in the three months to August, and that the employment rate fell by 1.4%-points over the same period.
To put this into context, the increase in the unemployment rate is the biggest three month increase in four years.
This means that there are 20,000 more people unemployed in Scotland, and nearly 60,000 fewer people in employment, than earlier in the year.
At the same time the UK unemployment rate rose slightly to 3.9% (up 0.1% pts relative to the three months before) and the employment rate fell slightly (down 0.2%-pts) to 75.9%
In this blog we run through the main conclusions from these data.
While it’s important not to get too carried away with one set of numbers, the fact that unemployment has been rising in Scotland, and employment falling, over the past year while the reverse has been happening in the UK as a whole, is something we need to keep an eye on.
The unemployment rate remains, by historic standards, relatively low and the employment rate remains relatively high, but what was surprising in today’s data, shown below, was the sharpness of the decline in the employment rate in the latest data.
Chart 1: Employment and unemployment rate in Scotland
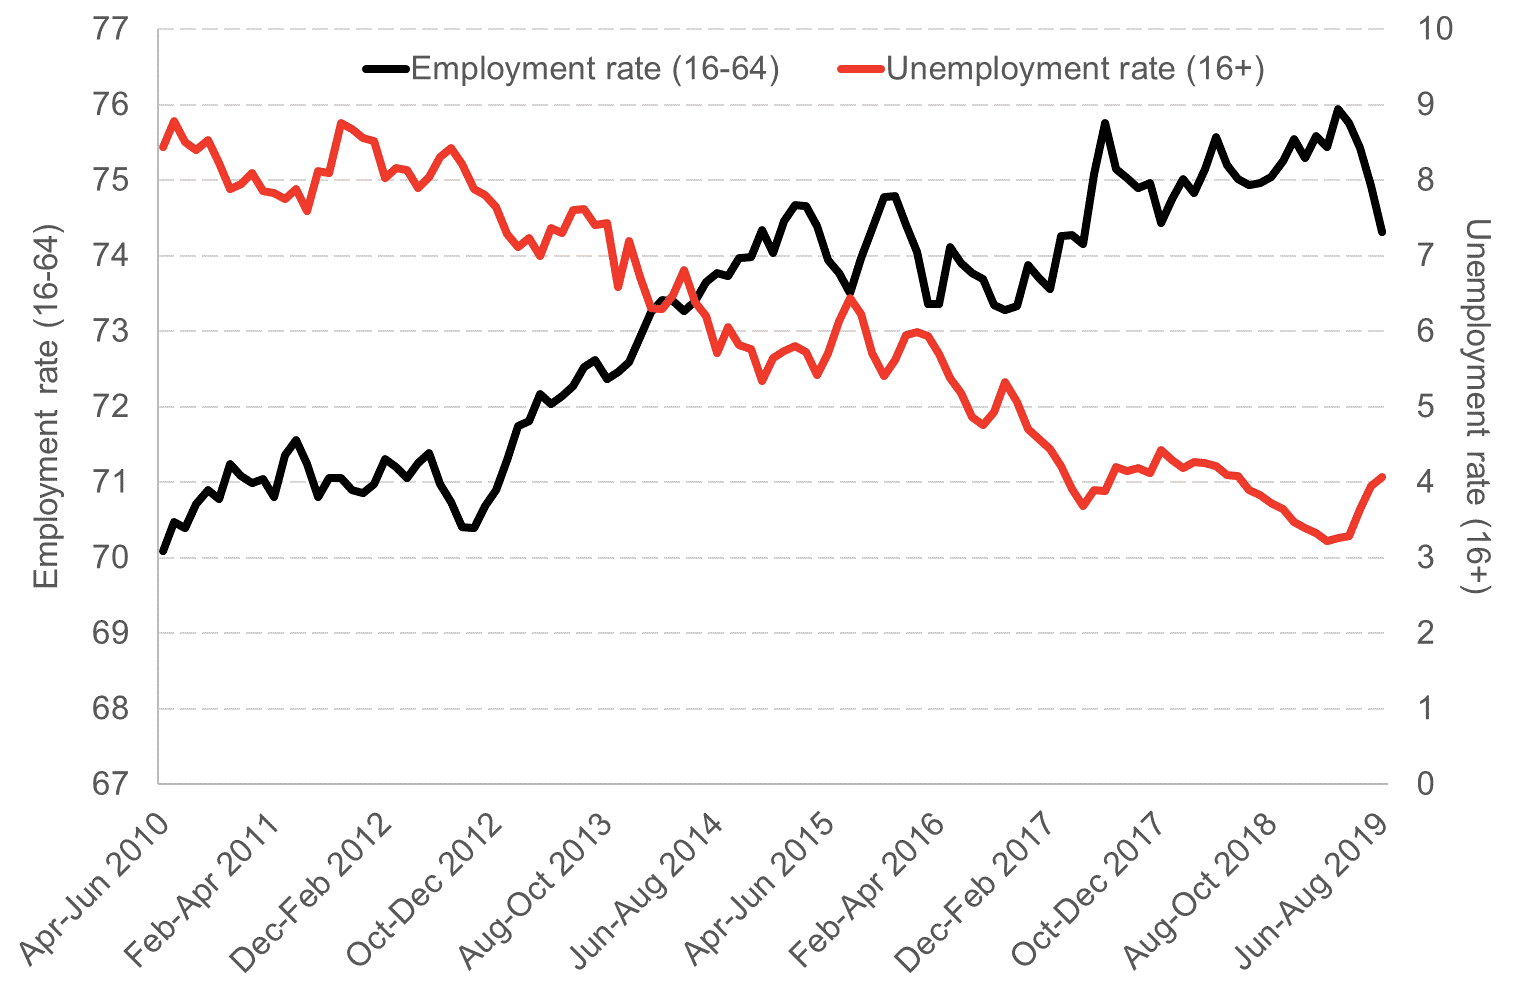
Source: ONS
We have seen some commentary that the main driver behind the drop in employment is Brexit related uncertainty.
While the economic headwinds caused by Brexit are real, this does not fully explain these data.
One way to see this is to remember that Brexit uncertainty is not isolated to Scotland, by definition it affects all parts of the UK. In this sense it is a ‘common shock’ to the economies of the UK.
When we look at the data, Scotland now has higher unemployment, lower employment and higher economic inactivity than the UK as a whole.
As the chart below highlights, over the past year the employment rate in the UK as a whole has risen, while in Scotland it has fallen. Over the past three months the UK employment rate has weakened a little, but the Scottish employment rate has dropped by far more.
Chart 2: Change in the employment rate in Scotland and the UK relative to the three months and year before
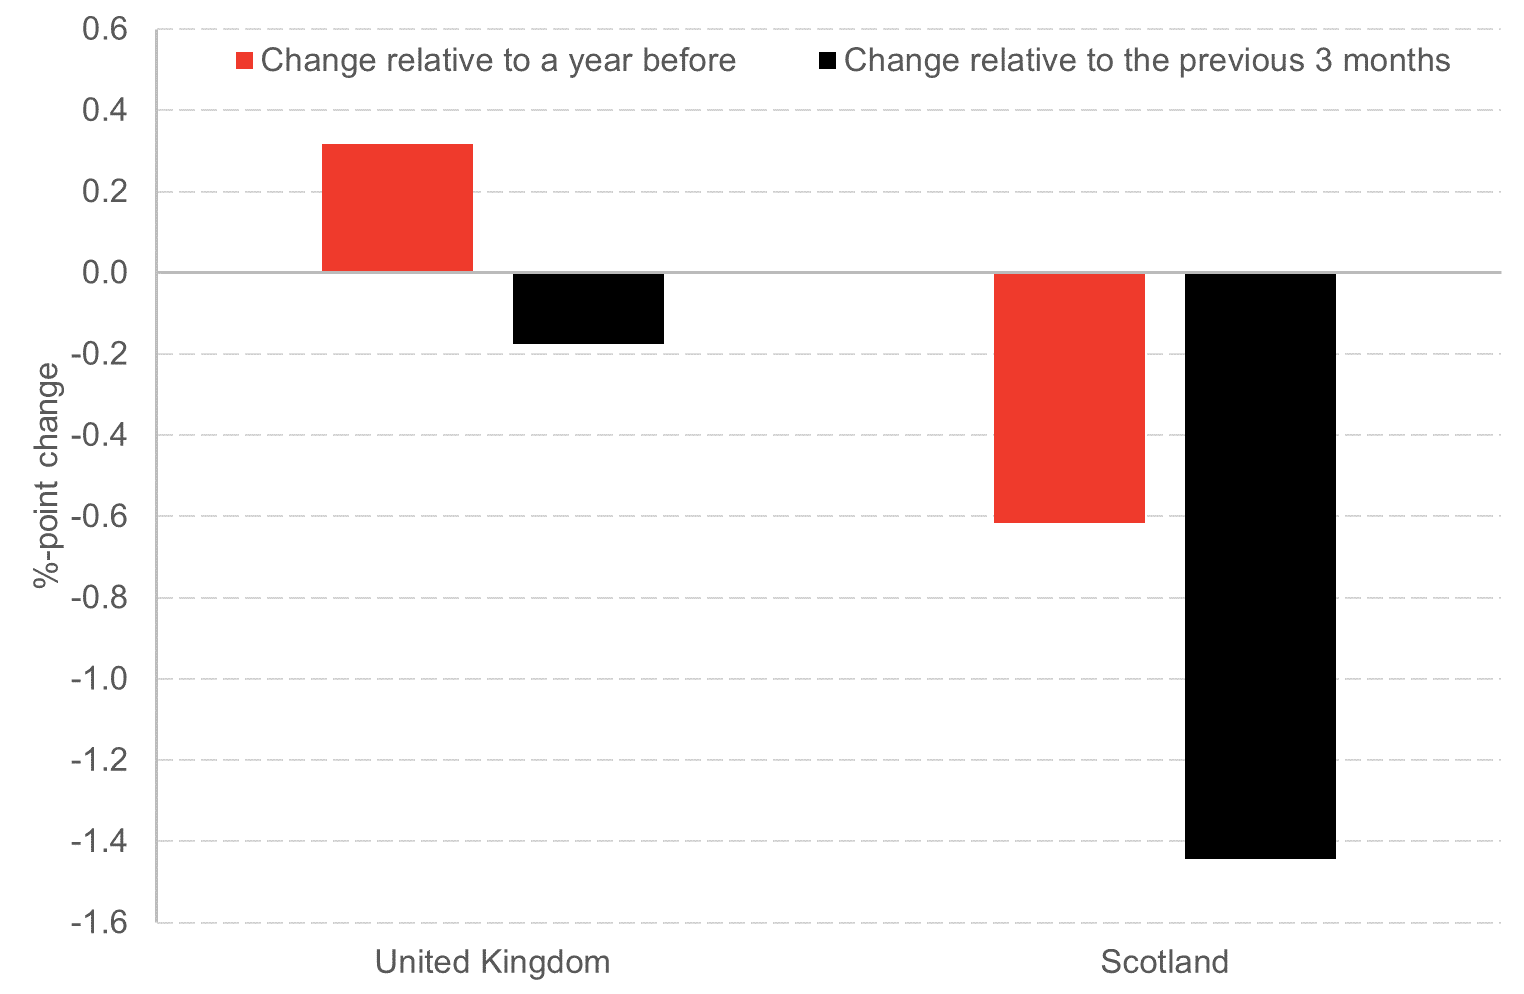
Source: ONS
When we compare performance across all parts of the UK on the same basis, we can see diverse economic experiences over the past year.
Some parts of the UK have seen their employment rate improve substantially (East Midlands, South East, South West and Northern Ireland), while others have seen their employment rate fall substantially (like Scotland, Wales and London).
It’s hard to see any pattern that suggests that a uniform Brexit effect can be the main driver of these economic fluctuations.
Chart 3: Change in the employment rate across the UK relative to the three months and year before
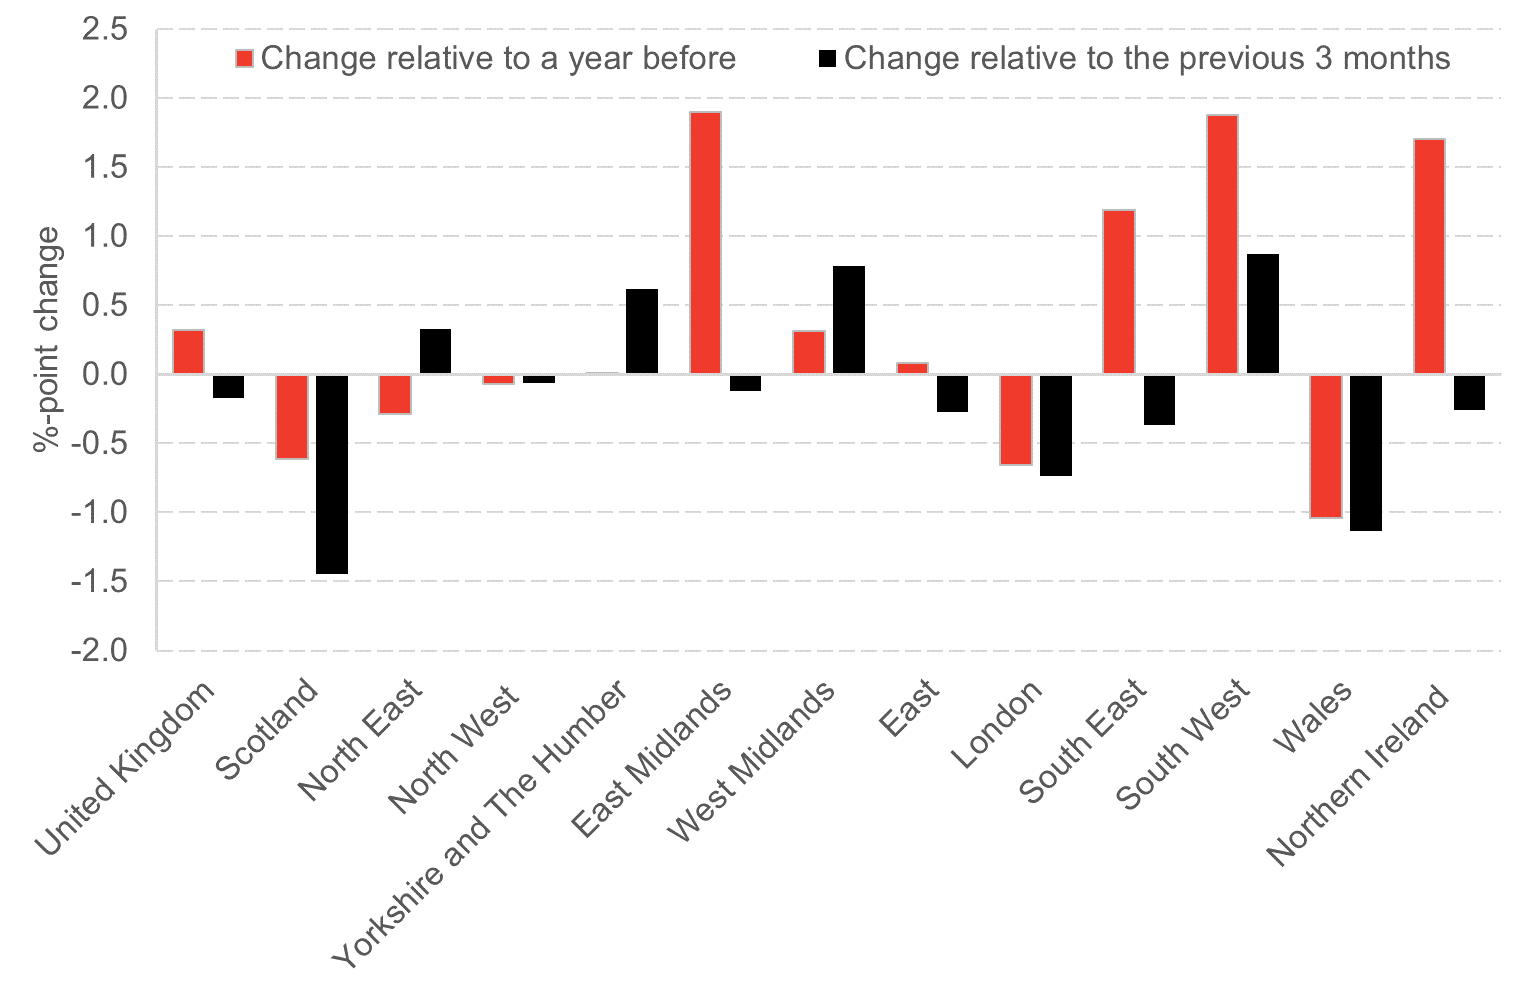
Source: ONS
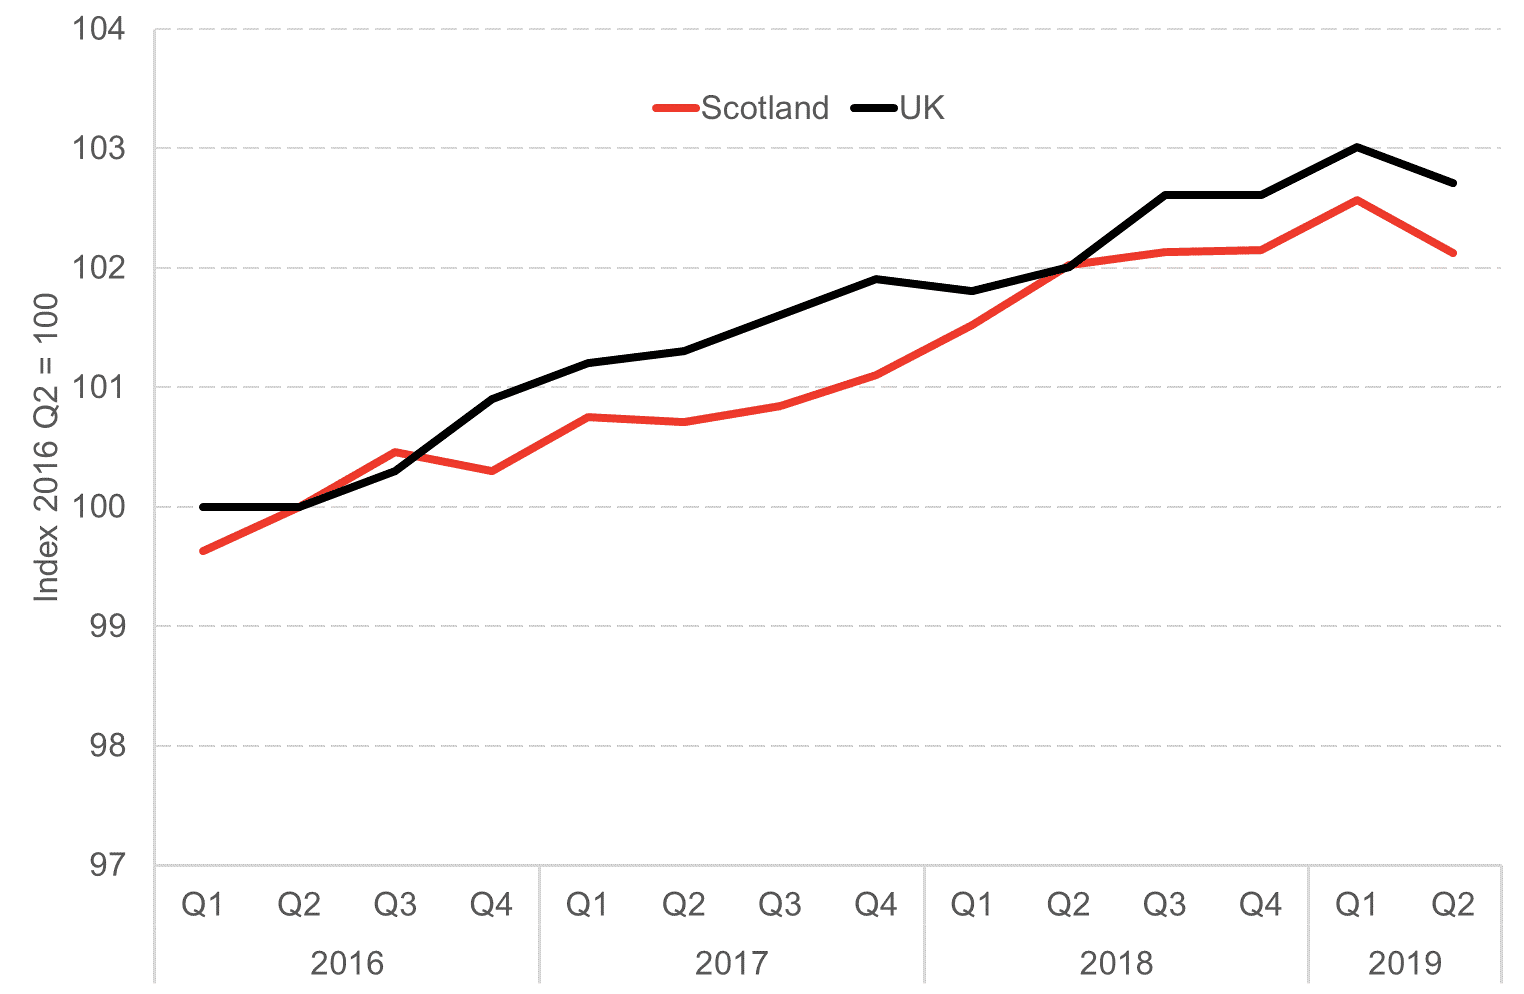
Today’s labour market data is broadly consistent with wider growth data on the Scottish economy. If we compare growth in Scotland and the UK as a whole over the period since the Brexit referendum in 2016, we can see that the Scottish economy has failed to match the growth experienced by the UK as a whole, both in terms of total GDP but also in terms of GDP per person.
In the chart below, the Scottish and UK economies are indexed to their size in 2016 Q2. The UK line being above the Scotland line indicates that the UK has grown more quickly both in total and per person since 2016 Q2. The bigger the gap between these two lines the more that the UK economy has grown relative to the Scottish economy.
Chart 4: GDP growth in Scotland and the UK since 2016
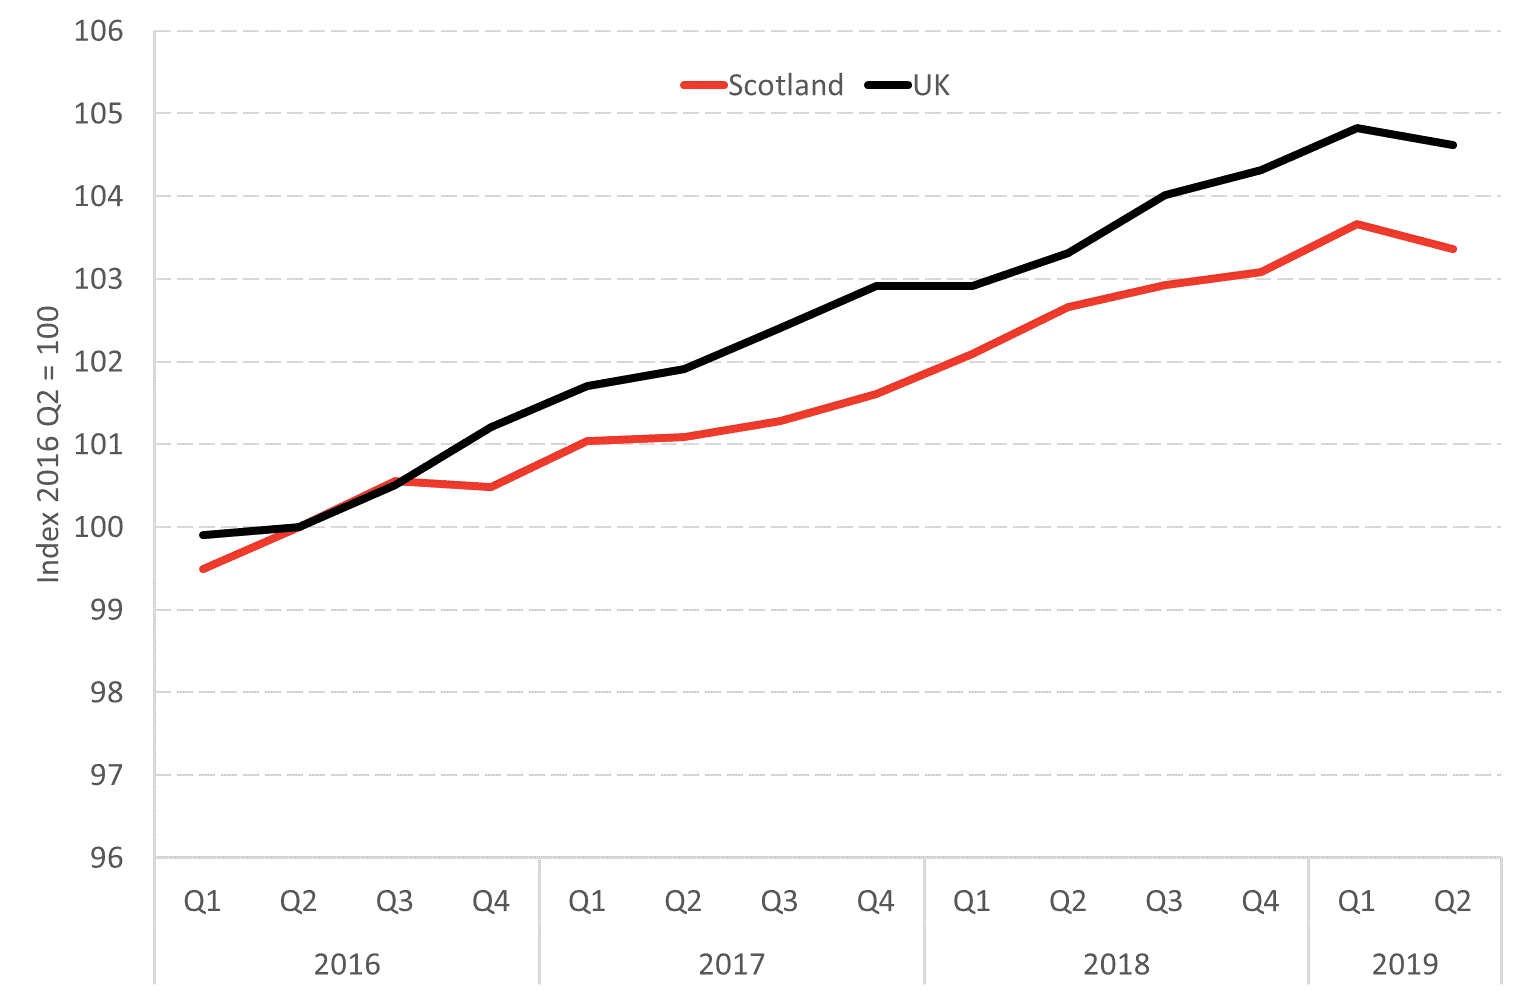
Source: Scottish Government
When we look at growth in per person terms, the situation is not much different. Over this period the Scottish economy has under-performed the UK as a whole.
Chart 5: GDP per capita growth in Scotland and the UK since 2016
Source: Scottish Government
These data, again, provide little evidence to support claims that the main driver of Scotland’s recent economic performance is a common UK wide Brexit uncertainty shock.
When we add a comparison with the growth of the EU 28 as a whole, as we do in the chart below, it underline that UK performance itself has been rather weak. With growth lagging the rest of Europe since late 2016. Thus not only is Scotland failing to keep pace with the UK, the UK is falling behind growth in the rest of the EU.
Chart 6: GDP growth in Scotland, the UK and the EU 28 since 2016
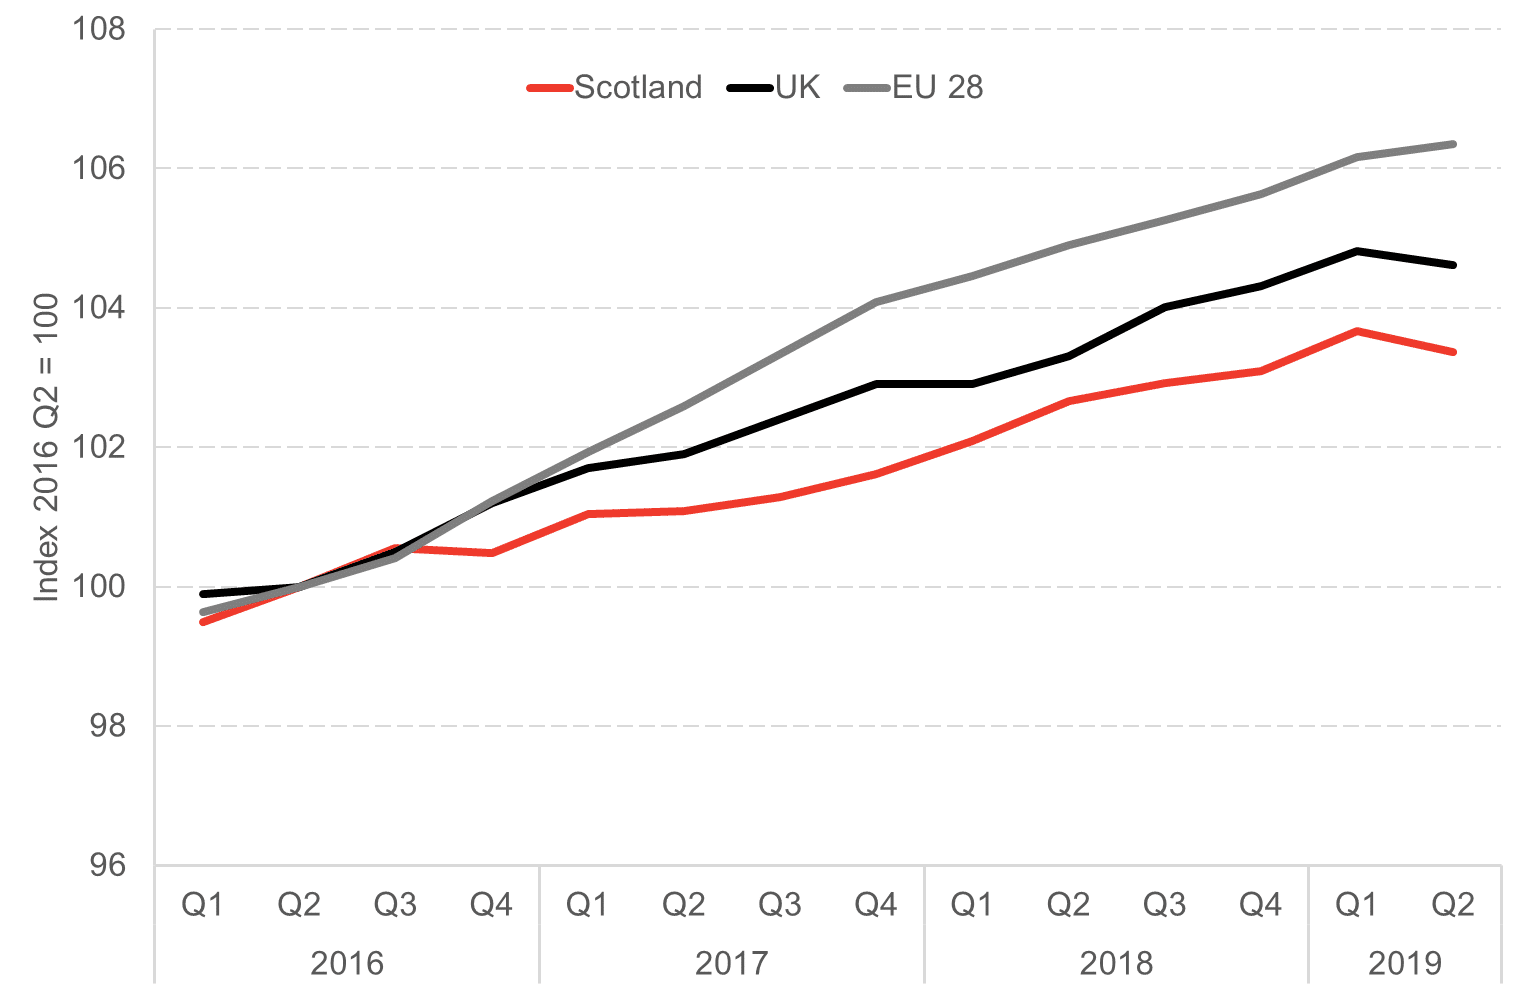
Source: Scottish Government, FRED
While we understand entirely why people are so focussed on Brexit, we have made the point before that one consequence of the Brexit debate is that it has crowded out attention for other longer term challenges facing developed economies across the globe, e.g. automation, climate change, population ageing, etc.
In the same way, it appears that Brexit is distracting attention from Scotland’s economic performance over the past few years. That there is not more attention given to this in Scotland remains surprising.
Authors
The Fraser of Allander Institute (FAI) is a leading economy research institute based in the Department of Economics at the University of Strathclyde, Glasgow.