Last week, the Scottish Government published updated labour productivity figures up to the third quarter of 2018.
The release was also effectively the first official assessment of Scotland’s international productivity performance up to the end of 2017.
Recall that this was the measure used to assess the ‘Scotland Performs’ target of being in the top quartile of OECD countries for productivity. Recall too that, back in 2007, the Scottish Government’s Economic Strategy set a target to reach this top quartile by 2017.
Last week’s data confirms that this target has been missed. Scotland’s productivity remains around 20% below target.
The latest productivity figures for Scotland broadly chime with the wider growth performance indicators of the last year or so.
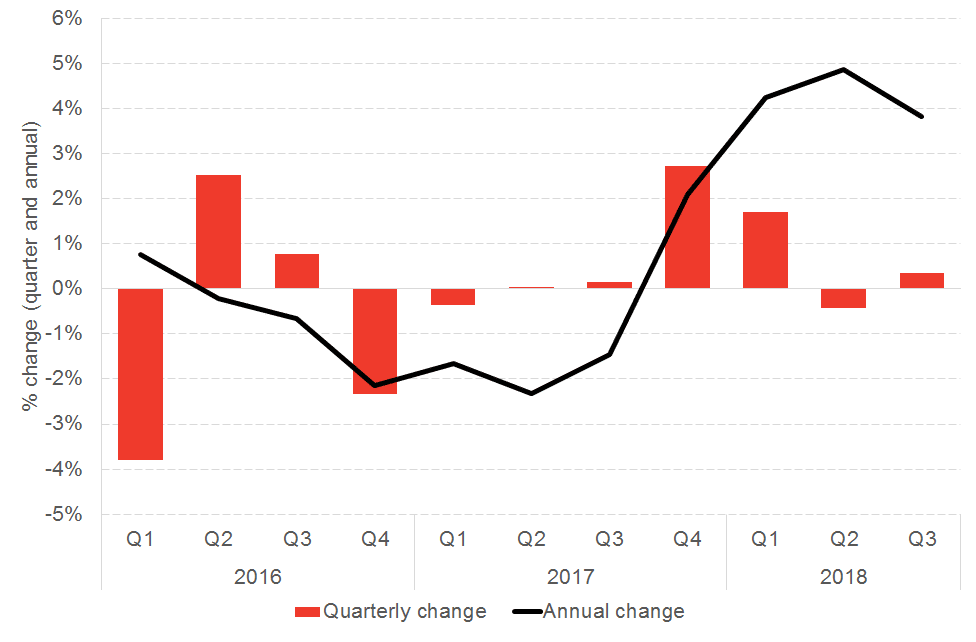
Relatively strong growth toward the 2nd half of 2017 and early 2018 has tailed off in recent times – see Chart 1. Indeed, the newly revised figure for Scottish GDP growth in Q3 2018 has been revised down to 0.2% (from 0.3%). This compares with UK growth over the same period of 0.6%.
The latest ‘trend’ data – i.e. adjusting for inherent volatility in the quarterly series – shows productivity growth was flat in the third quarter of 2018, following on from weak growth of 0.2% in Q2. In contrast, productivity had been growing at above 1% in the three quarters prior to that.
Chart 1: Latest Scottish labour productivity indicators
Looking at the raw data reveals what has been driving the swings in productivity growth rates in recent times.
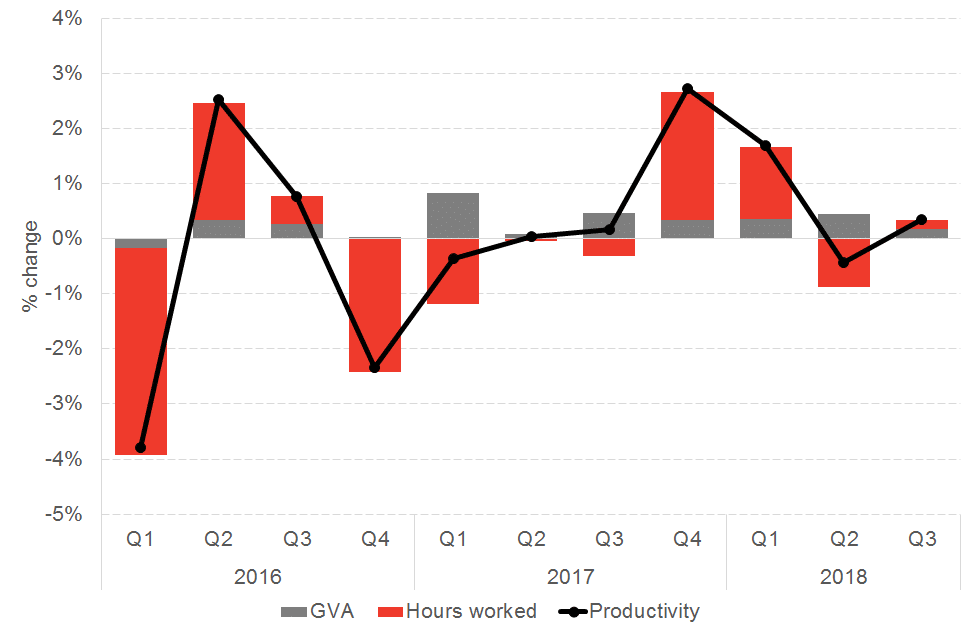
Remember, labour productivity measures how well output is fairing relative to changes in how much labour is being used to produce that output. If we’re able to produce more for the same amount of hours worked then we are more productive. On the other hand, if we are working harder but not producing much more, then our productivity will fall.
So it’s effectively driven by two things, the growth rate in output vis-à-vis the growth rate in hours worked.
As the chart highlights, it is changes in the hours that we are working that has been driving recent movements in Scotland’s productivity performance.
Chart 2: Drivers of Scottish labour productivity – GVA vs. hours worked (inverted)
But as we have said before, quarterly productivity figures can be volatile so it is more important to look at trends in productivity over a longer time horizon.
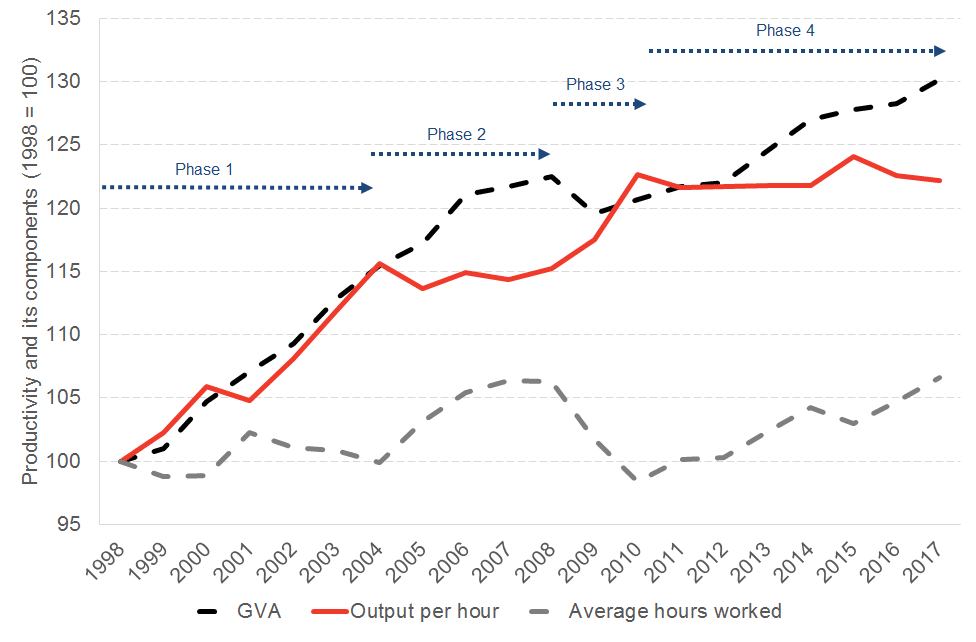
The chart below highlights changes in Scottish productivity since 1998. Some interesting patterns emerge.
Over the period 1998 to 2004 Scotland experienced strong growth in productivity driven by healthy growth in output and little change in hours worked. [Phase 1]
This was then followed by a period of growth in both output and hours worked, so that productivity as a whole remained relatively flat. [Phase 2]
During the financial crisis and subsequent recession, output slipped back, but this was more than matched by a fall in hours worked. As a result, productivity increased. [Phase 3]
But since 2010, productivity in Scotland has barely moved. [Phase 4]
The weak growth we have seen in output has been matched by growing hours worked. In effect, the growth in output witnessed over the last seven or eight years or so has come from there being more people in work – or working longer hours – rather than any improvement in efficiency.
Chart 3: Scottish labour productivity since 1998
How does Scotland compare internationally?
Firstly, recall that the Scottish Government had a target to be in the top quartile of OECD countries for productivity by 2017.
We have questioned the wisdom and achievability of such a target before. But irrespective of this, the target has been missed.
Whilst revised PPP data used to compare country-to-county performance has moved both Scotland and the UK back into the 2nd quartile of countries, this adjustment impacts upon the baseline rather than yearly changes. Overall Scotland’s ranking has barely moved in the last decade as the National Performance Framework confirms.
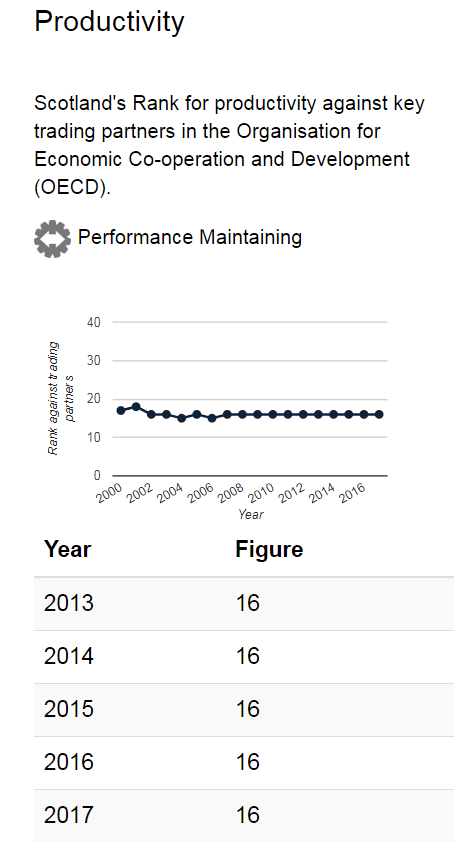
The key take away however from the latest data up to the end of 2017, is that productivity in Scotland remains around 20% lower than the entry point to the top quartile.
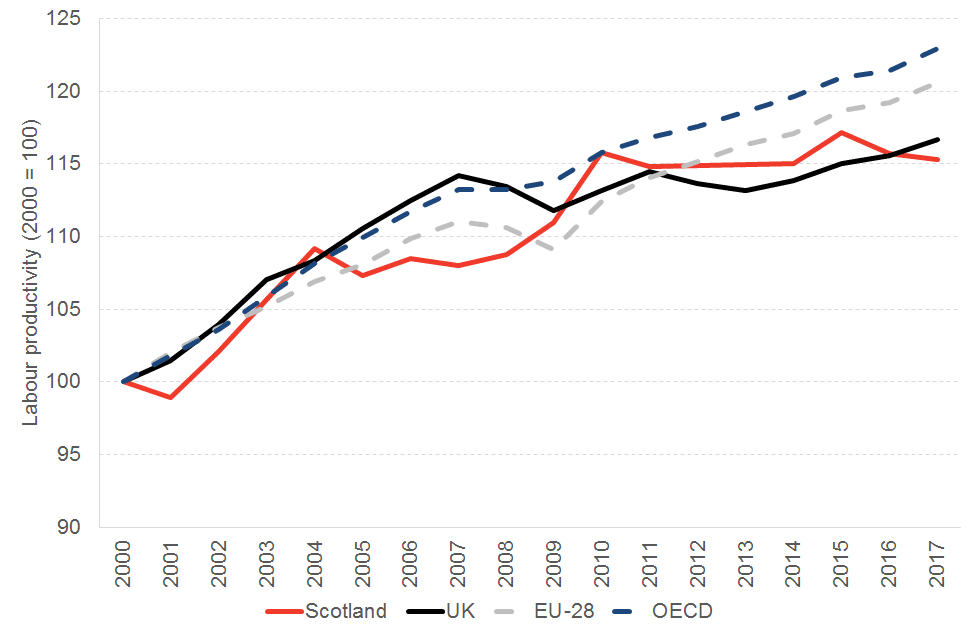
Little progress seems to be being made to narrow this gap. The chart below shows the growth in productivity in Scotland, the UK and the EU & OECD up to the end of 2017.
A number of observations jump out, but perhaps the most interesting is the flat lining of productivity performance over the last 10 years or so in both the UK and Scotland. In contrast, productivity across the OECD and EU has been on the rise.
Chart 4: Scottish, UK, EU and OECD productivity since 2000
Turning around this productivity performance is easier said than done. It requires investment in skills, training, innovation, infrastructure and entrepreneurship. [NB: It’s worth looking again at the blog published by Robert Zymek from Edinburgh University and our new recruit Mark Mitchell on benchmarking Scotland’s productivity performance.]
To be fair, a number of recent new initiatives, such as the country’s first innovation district in Glasgow, the new National Manufacturing Institute and the investment in the digital economy as part of the Edinburgh City Deal all suggest a much sharper policy focus directed at targeting Scotland’s productivity performance.
But such initiatives can only ever expect to have an impact at the margin. To really turn the dial, a much more significant change needs to occur. Brexit won’t make this any easier, but it arguably makes it more important than ever.
Authors
The Fraser of Allander Institute (FAI) is a leading economy research institute based in the Department of Economics at the University of Strathclyde, Glasgow.