
Last year, Glasgow City Council adopted a target of becoming carbon neutral by 2030. This ambitious target sees it aim for net-zero 15 years before the Scottish Government target date and 20 years before the UK as a whole. Emissions in the city have been falling in recent years, and the city has a number of strategies to reach this target. However, transport emissions are only falling slowly, car journeys are on the rise and public transport is a shrinking sector.
City level emissions targets are in place across the world, and some, like Tallinn (Estonia) have managed to reverse trends in falling public transport ridership with fare-free public transport (FFPT). In Tallinn, residents don’t pay to use the city’s buses, trams or trolleys. This raises an important question for Glasgow; can the city utilise FFPT and, more importantly, might fare-free public transport help Glasgow reach their 2030 carbon-neutral target?
Glasgow’s emissions target and policies around transport
Last year, Glasgow’s target for zero emissions was moved from 2037 (set as recently as 2017) to 2030. The first thing to note is that in, the UK, CO2 emissions are not measured at a subnational level. Instead, Glasgow’s CO2 emissions are estimated on a methodology by the Department of Business, Energy and Industrial Strategy (BEIS). As with any such modelling at a local level this raises some issues around data credibility and robustness.
The share of CO2 emissions from transport follow an almost identical trend in each city. The data for cities appear to reflect national trends, not the trends within the cities’ boundaries. Chart 1.
Chart 1: CO2 emissions from transport in Scottish cities, 2005 – 2018
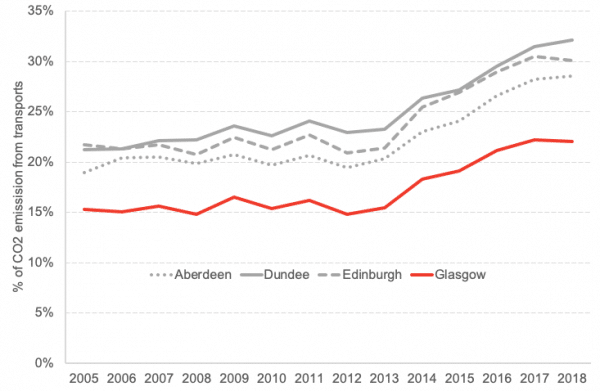
Source: BEIS
CO2 from transport in Glasgow has been declining slightly in recent years however, as one of the slowest declining sectors, its share in total emissions has risen 7 percentage points in the last 13 years, up to 22% of all CO2 emissions.
The importance of transport to Glasgow’s residents was picked up in a survey carried out by the council as they prepared their 2030 target. Here, the number one issue raised by residents was transport. The council has a number of strategies including encouraging active transport, electrifying the council’s fleet and creating a Low Emissions Zone (LEZ). While the first two of these will lower the CO2 emissions from vehicles, LEZs target NO2 emissions.
In addition, the Connectivity Commission for the council recently recommended reducing the cost of public transport for particularly price sensitive groups such as 16-18 years and apprentices. They reported that Glasgow residents in the lowest income quintile travel by bus three times more than those in the highest quintile suggesting they would benefit more from FFPT. The Commission also recommended building a metro system (a new light rail network) suggesting that buses alone are not the sole answer to increasing public transport ridership.
How do emissions relate to changes in road usage?
Transport is also related to non-CO2 emissions in the city. Both NO2 and CO2 are emitted by cars, so this implies a similar effect could be seen if CO2 emissions were also measured[1]. The effects of cars on air quality measures can be seen clearly when the roads are closed to vehicles. During the 2018 European Championships, for instance, for two Sundays in August, large sections of roads were closed for the cycling road races. The fall in emissions during such events is clear. See Chart 2[2].
Chart 2: Emissions during the 2018 European Championships, High Street and Byres Road
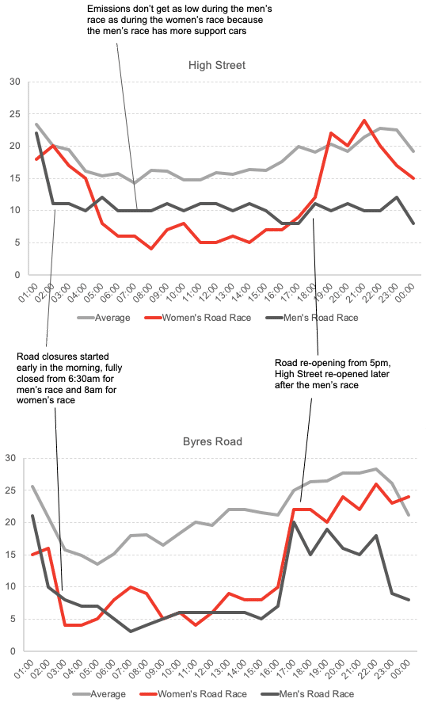
Source: Air Quality in Scotland
The drop in NO2 emissions can also be seen during the coronavirus lockdown, by looking at the daily average NO2 emissions during the month of May (the final month of complete lockdown) to the daily average of the previous four Mays (at the Hope Street sensor, situated just outside Central Station and recording the highest emissions in Scotland before lockdown). Again, the drop is visible, no daily average was as low as the daily averages from 2020 despite a slight increase towards the end of the month as restrictions eased. See Chart 3.
Chart 3: NO2 Emissions, May 2016-19 compared to May 2020, Hope Street
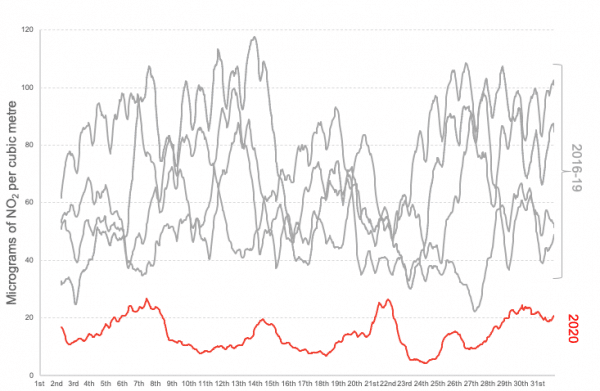
Source: Air Quality in Scotland
An alternative way of looking at this data is the monthly average. As can be seen, May 2020 had the lowest monthly average in the past five years, second lowest was April 2020 and the third lowest was June 2020. That is to say, there is a significant and measurable drop in NO2 emissions when vehicles are removed from the road. While it is clear that less vehicles on the road is environmentally beneficial, what this does not show is if public transport, specifically diesel buses, do pollute less than cars. See Chart 4.
Chart 4: Monthly mean NO2 emissions, Hope Street, January 2016 – June 2020
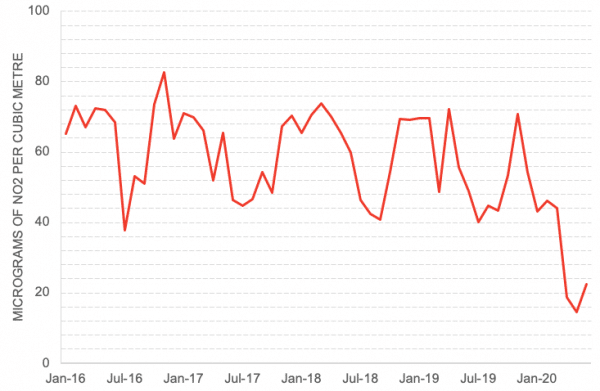
Source: Air Quality in Scotland
What do we know about current transport usage in the city and related emissions?
As mentioned, CO2 emissions are not measured at the council level and there is no breakdown of transport emissions. We can, however, use fuel usage which is broken down by vehicle type as a proxy. Of the fuel used in bus and car journeys in “South West and Strathclyde”[3] 6.3% is in bus journeys however, this comprises only 0.7% of the combined distance travelled. This suggests buses have a nine times higher environmental impact than cars which is understandable given the size of the vehicles and size of the engines. Of course, this is only part of the picture, buses can transport many more passengers even when running at half capacity for social distancing.
To instead compare the share of journeys taken by bus to the fuel used, we must look at Scotland-wide data. Some 6.4% of the combined bus and car fuel usage is from buses yet 10.9% of combined journeys are on buses. Newer, fuel-efficient cars are being registered while Glasgow’s bus fleet is shrinking, older buses are not being replaced and 2020 is the first year Glasgow will have permanent electric buses on their roads in fifty years. See Chart 5.
Chart 5: Journeys taken and fuel used by cars and buses, Scotland, 2018
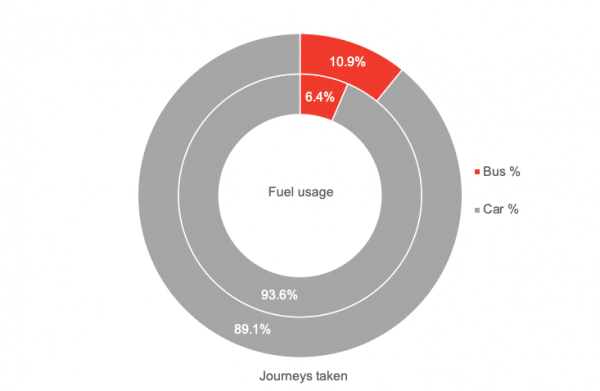
Source: BEIS, Scottish Transport Statistics
What have other cities learned about the possible impacts of fare free public transport?
While buses are greener, this does not necessarily mean that FFPT will work towards the 2030 carbon neutral target. The Texan city of Austin found that making public transport fare-free does not guarantee ridership increases in their yearlong fare-free experiment in the 1990s. How people travel in cities is intrinsically linked to the urban layout, making recent European systems worthy of particular focus. Tallinn (Estonia), a city three quarters the size of Glasgow, was suffering a decades-long decline in public transport ridership as well as a privatised sector with competing operators, similar to Glasgow. Since the introduction of FFPT in 2013 Tallinn has seen a consistent annual increase in ridership which, while it does partly come from people who previously walked, has also seen the number of car journeys have decreased by 10%.
Gothenburg and Copenhagen tried more targeted FFPT at car drivers, encouraging them to leave their cars at home. 25% of participants in Gothenburg used public transport instead of driving while Copenhagen saw ridership increase 40% five months after the end of the trial. When the Netherlands gave all students a choice of FFPT either on weekdays or the weekend, public transport increased from 11% to 21% of new journeys and 34% of new passengers previously travelled by car. Aubagne in France, although much smaller than Glasgow, saw public transport journeys increase from 1.9m to 5.5m after introducing FFPT and building a metro similar to the one recommended by the Connectivity Commission. Aubagne’s is one of the most successful schemes as 70% of new passengers previously travelled by car. Across Europe, whenever FFPT has been tried, these studies suggest that public transport usage has permanently increased and, where recorded, car journeys have declined.
Fare-free public transport is not without its own cost. In Tallinn, surrounding towns lost funding as former residents re-registered in Tallinn to benefit from FFPT, this helped Tallinn cover the costs at the detriment of other towns. While FFPT in Glasgow would have to be covered directly by the Scottish Government, it would either mean a loss of funds for public transport across the country or an increase in taxes nationwide. Tallinn covered the rest of the cost of FFPT with increased parking charges, again paid for by non-residents.
From these examples, we see a common thread: fare-free public transport increases bus ridership, replacing car journeys, and leading to lower emissions while the buses left on the road are more efficient because of the number of people they can transport. FFPT fits with Glasgow City Council’s new goal of a carbon-neutral city. All Glasgow buses, unlike the subway or trains, currently run on diesel, the first electric buses in over fifty years are being rolled out this year. Diesel buses, while better than cars, still produce emissions so FFPT is not enough alone. The council do not have the power to replace the diesel buses with electric vehicles, but the restrictions included in the LEZs can incentivise bus operators to decarbonise their fleets. While FFPT is not without its own cost, FFPT would work towards Glasgow City Council’s 2030 carbon neutral target, as part of the suite of other policies aimed at lowering emissions in the city.
[1] This year, the Global Environmental Monitoring and Measurement Initiative (GEMM, a collaboration between various universities, including the University of Strathclyde) are installing 25 CO2 sensors throughout the city to provide real time CO2 data as opposed to two years in arrears
[2] As mentioned, CO2 emissions are not currently measured in Glasgow but NO2 emissions, another common pollutant from vehicles, are measured in micrograms per cubic metre (µgm-3) at specific points throughout the city. This hourly data from the Sundays of the road race is compared to the average Sunday in August for the five years data exists (2015-2019) at two points on roads closed during the road race, Byres Road and High Street.
[3] South West and Strathclyde covers Dumfries and Galloway, East Ayrshire, East Dunbartonshire, East Renfrewshire, Inverclyde, North Ayrshire, North Lanarkshire, Renfrewshire, South Ayrshire, South Lanarkshire and West Dunbartonshire as well as Glasgow, this is roughly 40% of Scotland’s population but is he level most local to Glasgow for which data exists
Authors
Fhinan Beyts
Finn is an undergraduate economics student at the University of Strathclyde.