It is exactly 10 years since Scotland – like many other parts of the world – slipped into recession as the global financial system ground to a halt.
A decade later, how have we fared? In this blog, we look back at Scotland’s economic performance over the last decade.
We also provide some comments on the new Scottish Government Economic Action Plan announced today.
The 2008 and 2009 recession
It is hard to believe that 10 years have passed since the height of the financial crisis. For many of us, it feels like yesterday. But a lot has happened since then. In 2008, iPads, Spotify, Uber and Google Chrome were all things of the future.
So what happened?
Growth in the Scottish economy started to slow in 2007 as concerns emerged about the health of the US housing market.
As the crisis gathered momentum, the Scottish economy like many other advanced economies, fell into recession. Output fell for four consecutive quarters. Whilst there was a modest recovery in Q3 2009, output fell again in the final quarter of that year.
Chart 1: Scottish GDP 2006 to 2012
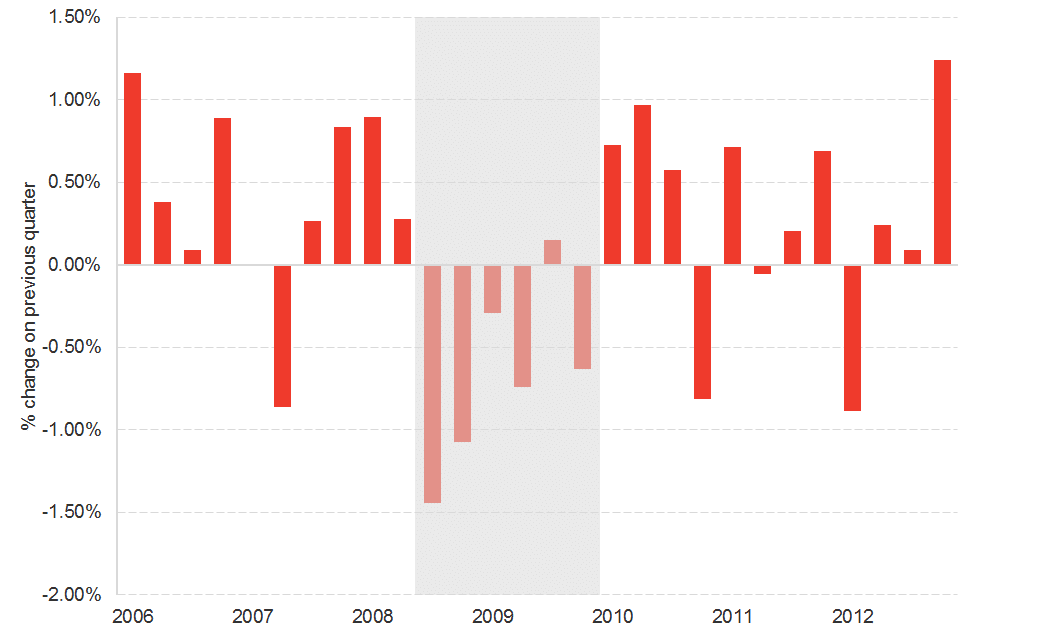
Source: The Scottish Government
Overall, the recession wiped 4% of output from the Scottish economy. The decline in GDP per head was even sharper, with a fall of 4.8% from peak to trough. But Scotland did hold up better than the UK as a whole. UK output fell by over 6%.
In the past, our economy had bounced back relatively quickly in the aftermath of any downturn. But on this occasion, it took around 5 years for output to return to its pre-crisis level in Scotland.
Chart 2: Scottish and UK peak to trough (and recovery) during the Great Recession
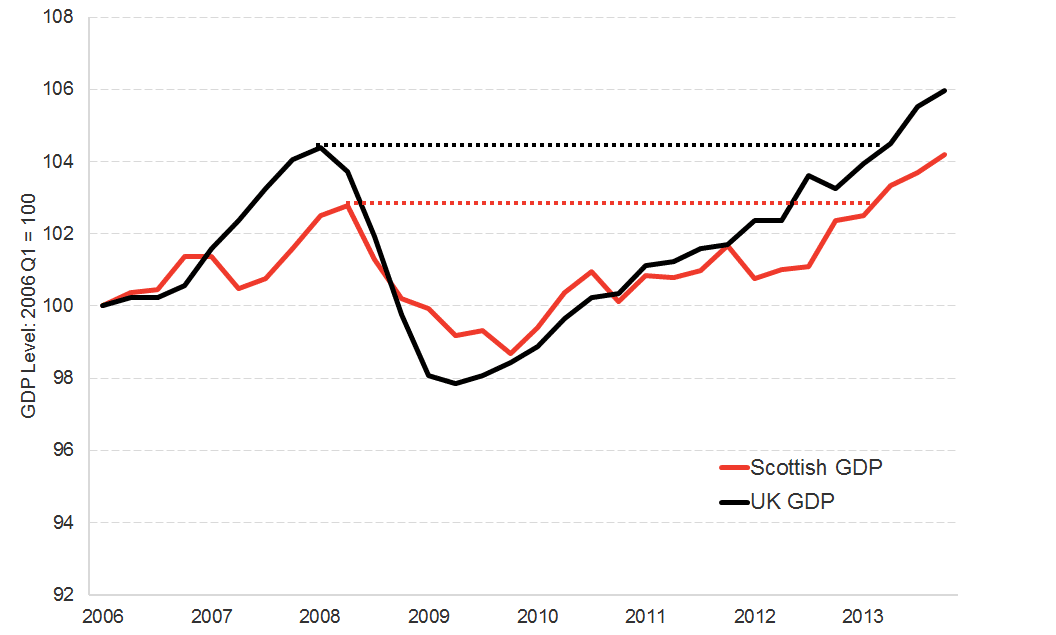
Source: The Scottish Government
And, whilst the UK economy suffered a deeper recession than Scotland (driven by a much sharper fall in services output), it has performed better in the recovery period.
The key difference has been the last 4 or 5 years, with UK GDP and GDP per head growing faster than in Scotland. This, in part, reflects the challenges in oil and gas, but also Scotland’s fragile growth more generally over the last few years.
A BRIEF ASIDE
Work with us
We regularly work with governments, businesses and the third sector, providing commissioned research and economic advisory services.
Find out more about our economic consulting in Glasgow.
Chart 3: Scottish and UK economic performance since the financial crisis

Source: The Scottish Government
In summary, Scotland’s economy has had a tough decade.
Today, GDP per head in Scotland is just over 1½% greater than it was 10 years ago – an average growth rate of less than 0.2% per year. This compares to growth of around 20%, or around 2% each year, in the decade 1998 to the end of 2007.
Whilst the recovery has been weak, perhaps the financial crisis itself was not as bad as first thought?
Interestingly, there have been major revisions to the measurement of the 2008/09 recession – with the downturn now much less severe than it was initially measured to be.
The chart below shows the recession as estimated in April 2012, April 2014 & April 2016, and finally today (Sep 2018).
In 2012, the peak to trough decline in output was estimated at 5.8%. Nearly 50% bigger than the current estimate. Some of this reflects a shallower downturn, but also a smaller boom just before the crisis.
Chart 4: Scottish recession during the financial crisis – the impact of data revisions
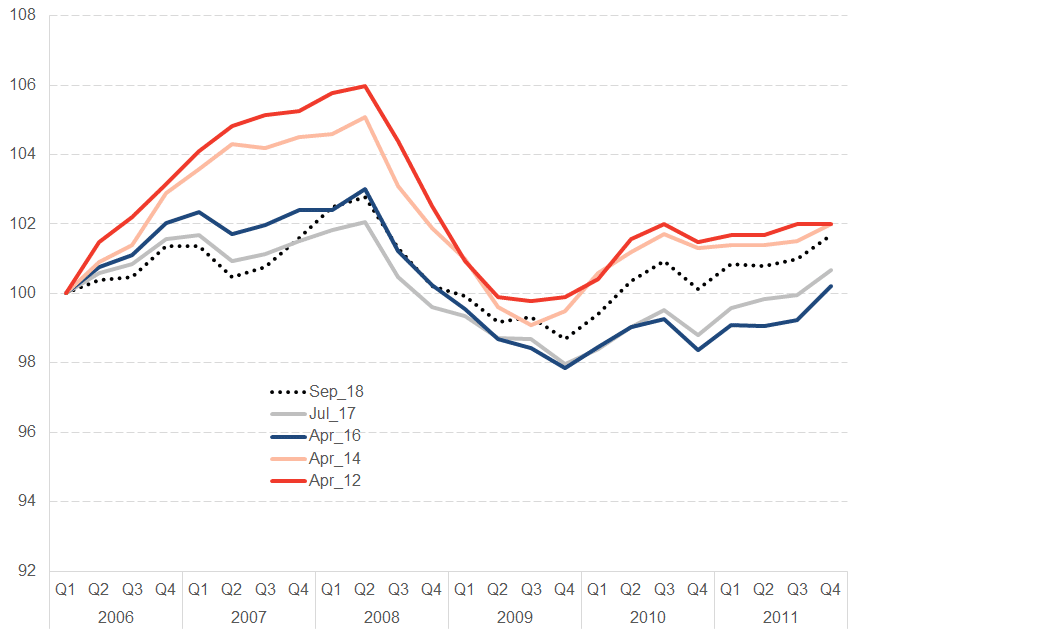
Source: The Scottish Government
What sectors were impacted?
The impact of the financial crisis varied significantly by sector.
In production, output fell by nearly 10% in a year. It wasn’t until the second quarter of 2013 before output recovered to its pre-recession high.
Unsurprisingly, construction bore the greatest brunt. By the end of 2009, the sector had shrunk by 23%. And according to the newly revised data from the Scottish Government, the sector in Scotland is still smaller than it was 10 years ago.
Chart 5: Scotland’s construction sector since the financial crisis
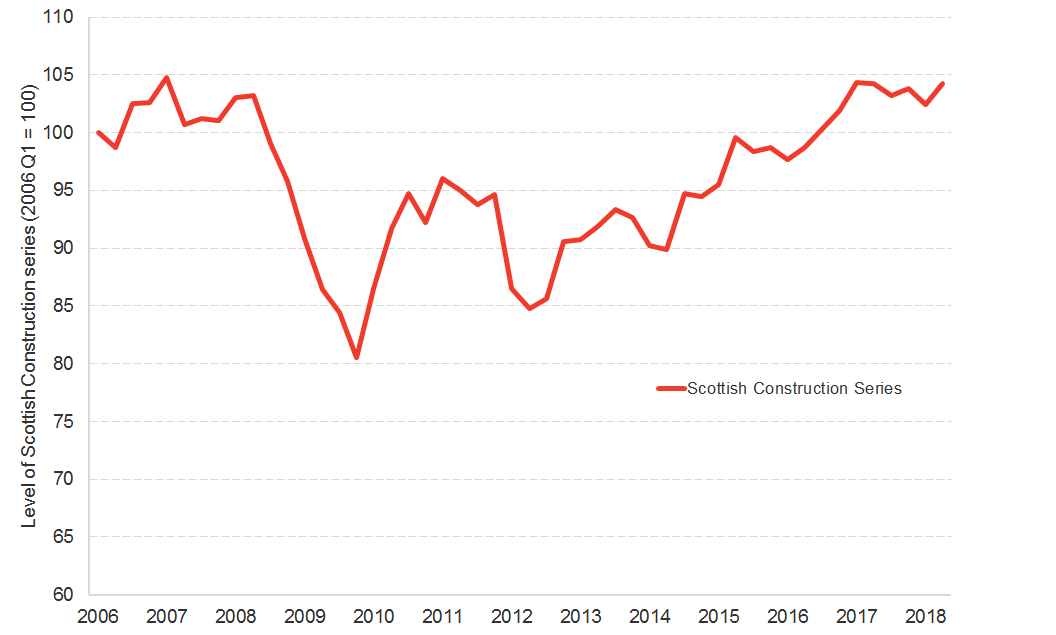
Source: The Scottish Government
Overall, services fared much better. Output only fell by 1.6%, although it still took until 2012 before activity had crossed back over its pre-crisis level.
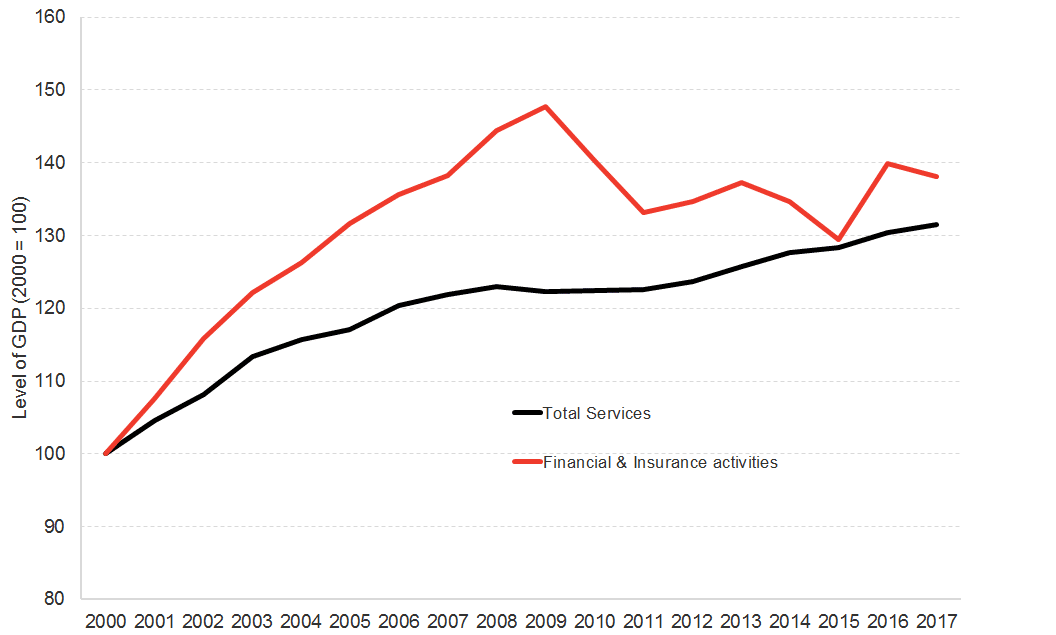
Of course, one of the sectors which faced the greatest challenge was financial services.
Output in financial and insurance activities fell by around 12%. It has recovered a little since then, but today it is still over 7% smaller than its pre-financial crisis level.
Interestingly however, looking at a longer time horizon – since the start of the century – financial services are now pretty much where they would have been had they grown in line with the average rate of growth across services as a whole. This perhaps reflects just how unsustainable the ‘good’ times were during the early 2000’s but also the underlying resilience of the (non-banking) sector since.
Chart 6: Services and financial services since the financial crisis
Source: The Scottish Government
The labour market has performed much better than expected
A key concern from past recessions – and the recent experience of Europe – was that unemployment could rise significantly.
However, the labour market has held up much better than anticipated.
Chart 7: Scotland’s labour market: employment and unemployment
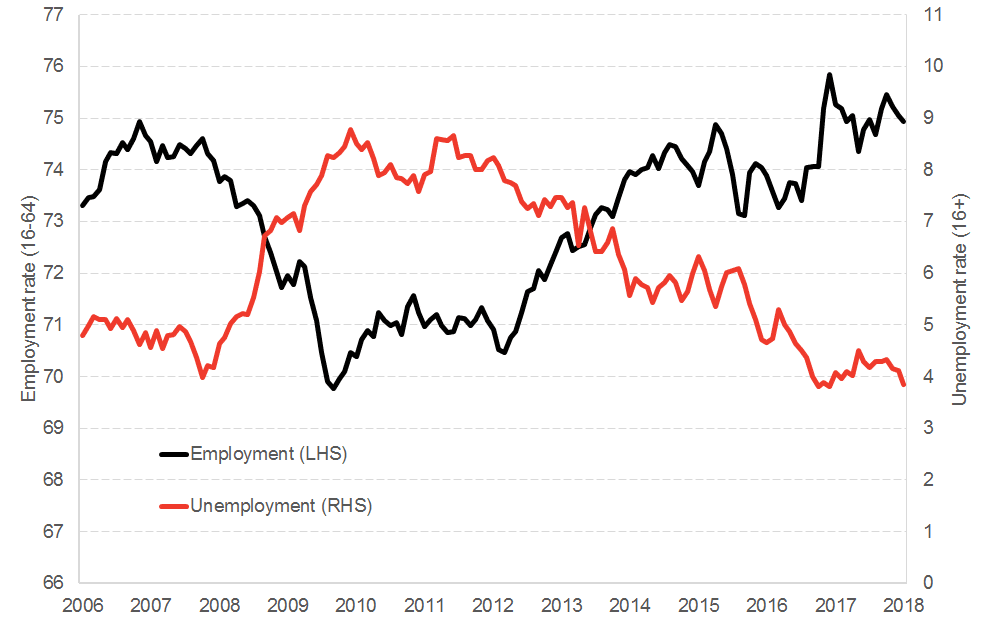
Source: ONS, LFS
Unemployment rose to 8.9% during the period May-July 2010 and then again to 8.7% in Nov-Jan 2012. This was the highest rate of unemployment since 1997.
But as the chart highlights, unemployment has since fallen sharply and now stands at just 3.9%. This is well below the long-term Labour Force Survey average since 1992 of 6.9%.
Scotland’s current employment rate is slightly behind that of the UK (although we do have a lower unemployment rate). Overall, these differences are not statistically significant.
Table 1: Labour market, Jun-Aug 2018
| Employment
(16-64) | Unemployment
(16+) | Inactivity
(16-64) | |
| Scotland | 74.9 | 3.9 | 22.0 |
| England | 75.8 | 4.1 | 20.9 |
| Wales | 75.1 | 3.8 | 21.9 |
| N. Ire | 69.2 | 4.3 | 27.5 |
| UK | 75.5 | 4.0 | 21.2 |
However, these headline employment and unemployment rates hide significant changes in the labour market in Scotland over the decade.
Firstly, whilst overall numbers of people in employment have risen, there has been a sharp rise in self-employment. Since 2006, the number of ‘employees’ in Scotland has risen by around 2.5%. In contrast, self-employment has risen closer to 20%. However, as the chart below shows it is important to put such growth in context. Whilst the percentage growth in self-employment has been much greater, the actual rise in the number of employees has been slightly larger.
Secondly, there has been a shift toward part-time employment over the period. Currently, around 27.1% of work in Scotland is part-time, compared to closer to 25% prior to the financial crisis.
Chart 8: The changing nature of work in Scotland
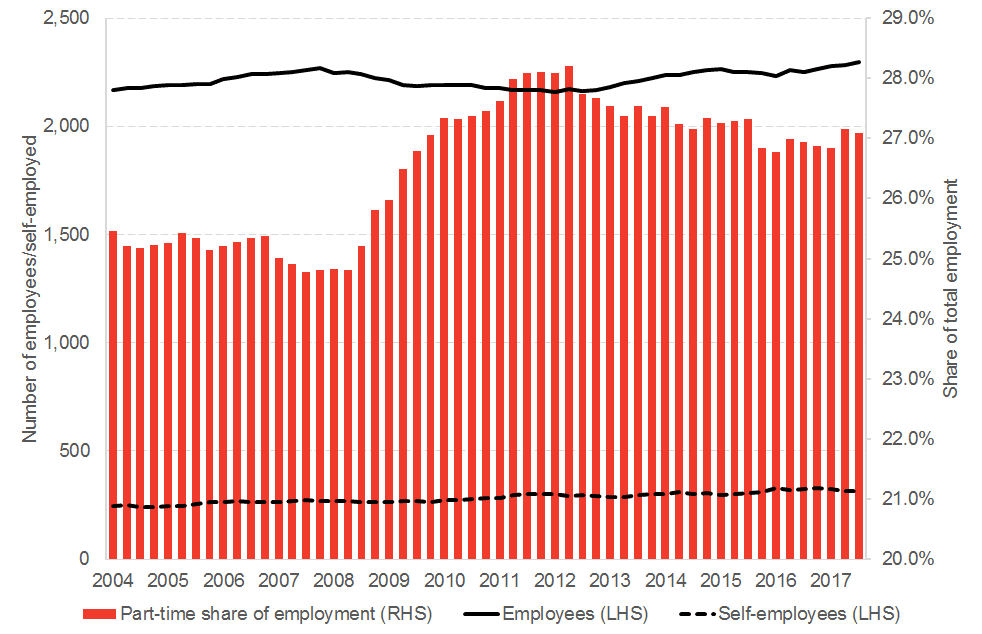
Source: ONS, LFS
Earnings haven’t kept up with prices
But whilst the aggregate headline indicators have performed relatively strongly, conditions for people in work have weakened.
Chart 9: Median real earnings in Scotland and UK CPI inflation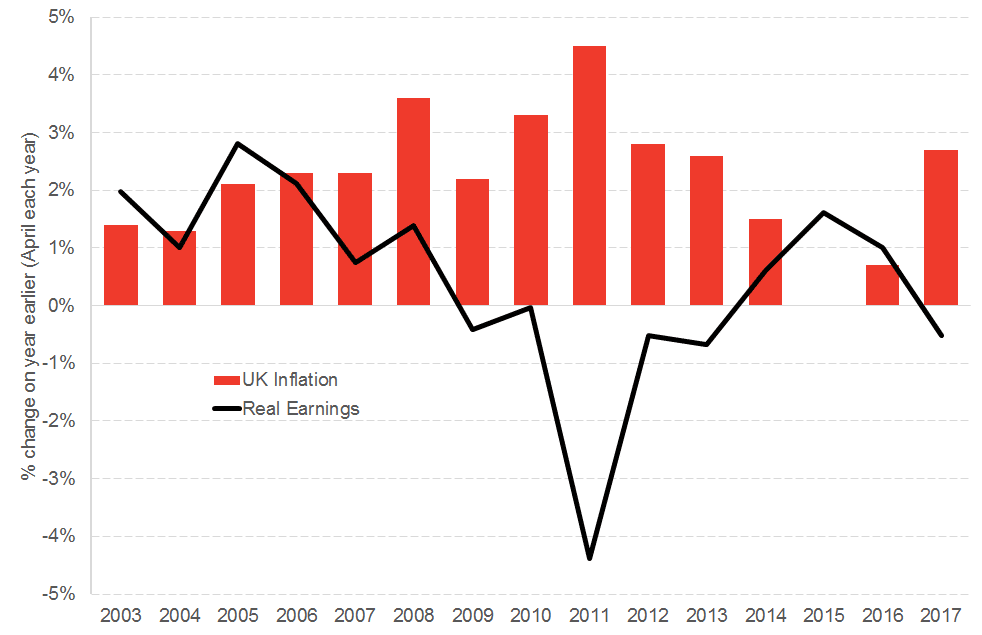
Source: ONS, ASHE
Earnings have lagged behind prices for much of the decade.
In the public sector, a pay freeze (from 2011) and pay cap (from 2013) has kept wage rises below inflation, while in the private sector, wage growth has also been slow. The recent spike in inflation following the sharp fall in the pound after the Brexit referendum has acted to erode real earnings once again.
According to the Scottish Fiscal Commission, this trend of weak conditions for households is forecast to continue. Their latest assessment – published in May – is for real household incomes per head to be below pre-financial crisis levels even by 2023.
Poverty levels in Scotland have, as a result, remained stubbornly high.
Chart 10: Relative poverty in Scotland (before and after housing costs)
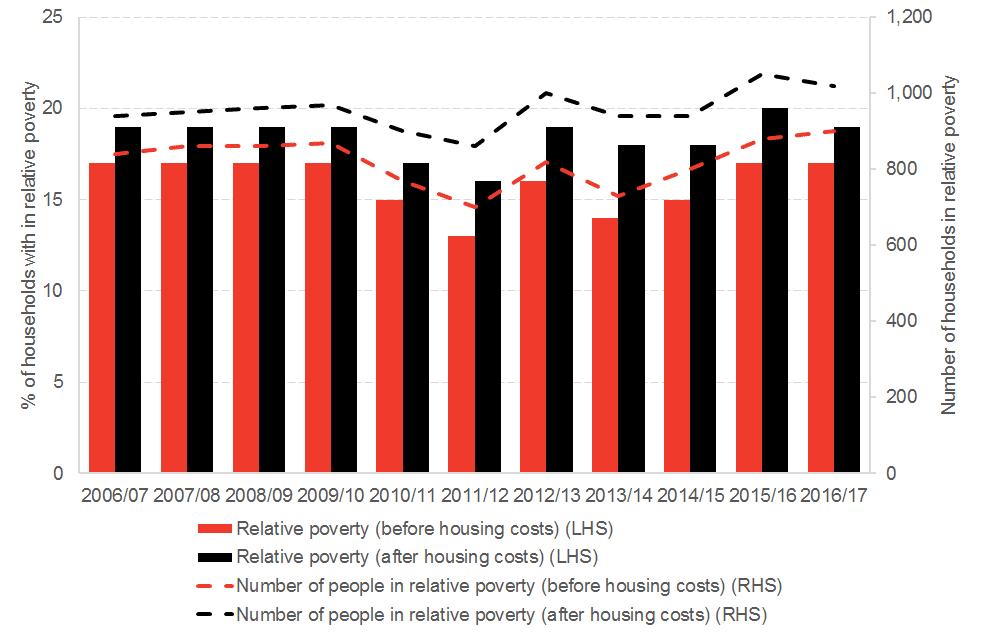
Source: Scottish Government
The productivity puzzle
The key reason for weak earnings growth has undoubtedly been the poor performance of productivity.
Productivity had been rising steadily before 2006, but the pace of growth has been much slower since. Had the pre-2006 trend continued, productivity in Scotland would be over 15% higher than it actually was in the first quarter of 2018.
Chart 11: Productivity in Scotland
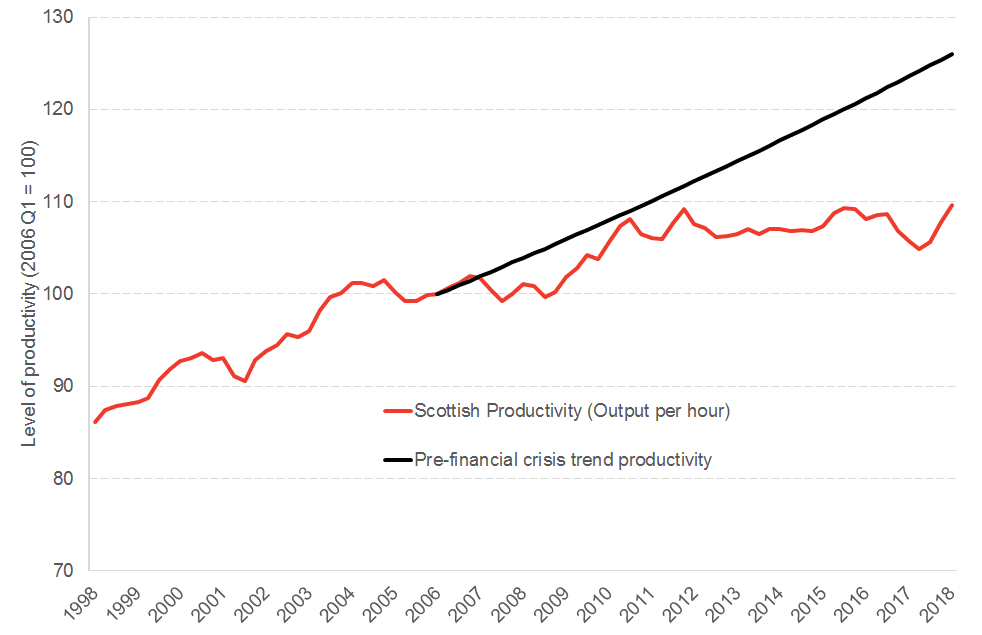
Source: Scottish Government
The phenomenon of low productivity growth has been common to many economies across the world. Lots of reasons have been suggested for this, low levels of business investment, so-called ‘zombie companies’ and a shift toward low-value labour costs.
Scotland has caught up on the UK in terms of its relative productive performance.
Chart 12: Scottish vs. UK productivity
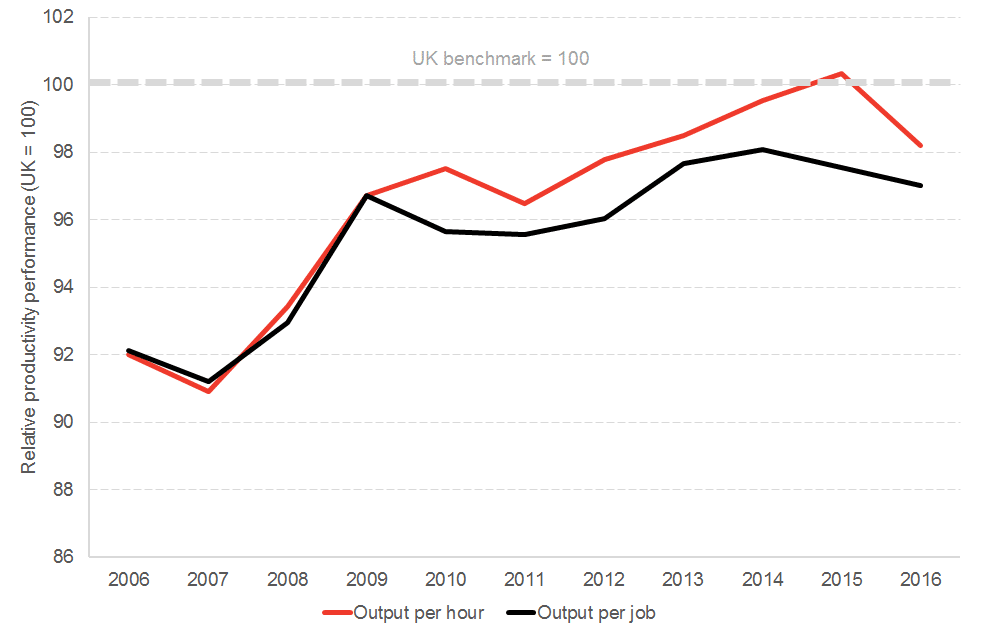
Source: Scottish Government
But as we have discussed elsewhere, comparisons with the rest of the UK are not that flattering once you extend this to a wider international context. Back in 2006, Scotland was in the third quartile of OECD countries for productivity. We remain in that quartile today.
Summary
The last ten years have been challenging for the Scottish economy.
Scotland has – of course – not be alone, with many countries struggling from weak productivity and/or fragile labour markets.
What has been surprising has been the lack of a major debate about Scotland’s economic performance. Much of the discussion has centred upon the constitution and the potential impacts both positive and negative of independence (or Brexit).
We argued back in March that it was perhaps time that the government looked again at its overall approach to economic policy to ensure it retained a clarity of focus.
We have yet to see much in the way of evidence to respond to that point of view.
Today’s Economic Action Plan instead contains a long list of government initiatives with (impressive) price tags.
All of these are well intentioned, but what does the action plan genuinely say to us about the coherence of the government’s economic approach beyond simply a recording of money spent?
Some questions that may be worth reflecting upon –
To what extent is such activity underpinned by an evaluation, monitoring and understanding of what works? How is the evidence shaping up on whether or not such spending is delivering the desired outcomes? What has been the impact of any changes in policy in response to new priorities, successes and/or failures?
And where is the clarity of purpose on which all policies are aligned behind that underpins what the government is trying to achieve?
A list of actions looks impressive. But will it deliver the transformational change Ministers have set their sights upon?
Authors
The Fraser of Allander Institute (FAI) is a leading economy research institute based in the Department of Economics at the University of Strathclyde, Glasgow.