
Introduction
Back in 2019, Boris Johnson promised to “unite and level up” different regions of the UK. In particular, Johnson promised to boost economic prosperity in “left-behind” regions, outside London and the South East.
Given that the UK has one of the highest levels of regional income inequality across developed countries, a leveling up agenda could support inclusive growth.
But where does Scotland fit into this picture?
At first glance, Scotland has income levels close to the UK average. However, when looking at smaller regions within Scotland, income levels vary widely.
This becomes clear when looking at Gross Disposable Household Income (GDHI) data, published by the Office for National Statistics (ONS). GDHI per head is a good proxy for material welfare, as it measures individual disposable income, after taxes and benefits. It is available for three levels of regional aggregation.
NUTS 1 level
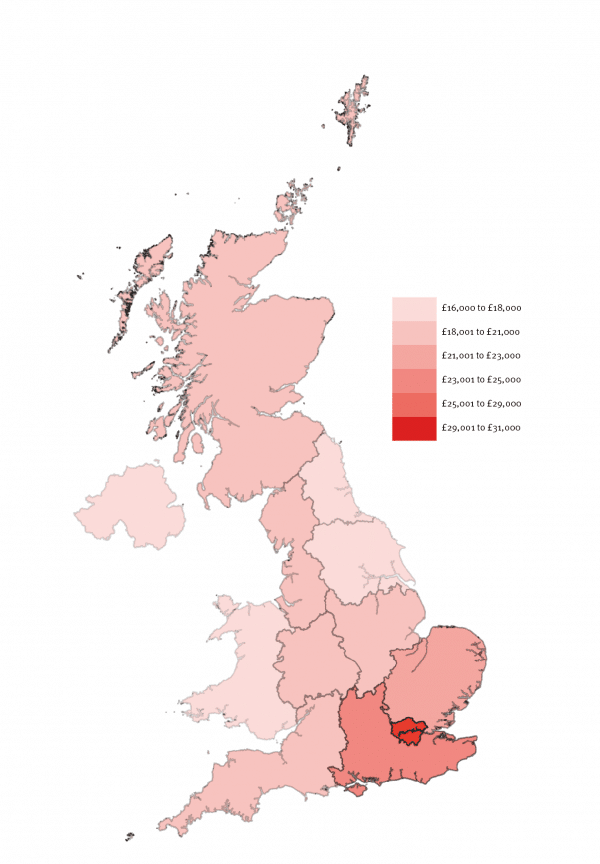
The broadest aggregation is defined by ‘NUTS 1’ regions. This includes Wales, Northern Ireland, and nine regions in England. Among those, London has the highest GDHI per capita, emphasising its longstanding position as the UK’s economic powerhouse. In contrast, North East England as well as Northern Ireland and Wales consistently lag behind. Incomes in these regions are more than 40% lower than in London, making them possible candidates for “levelling up” policies. Figure 1.
Figure 1: Regional GDHI per capita across UK NUTS 1 regions in 2018
Source: ONS; FAI
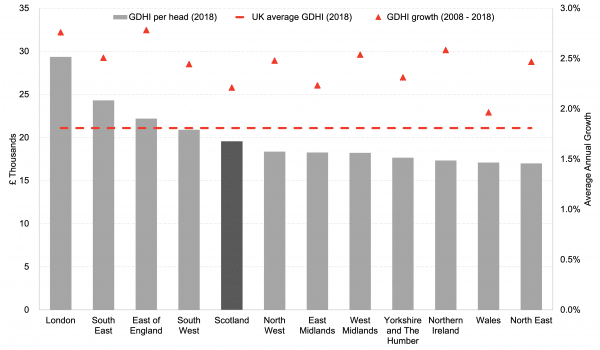
At around £20,000 GDHI per head in 2018, Scotland takes up a position in the midfield, close to the national average of £21,000. However, at 2.2%, Scotland had the second lowest average annual growth rate in GDHI per head over the 2008 – 2018 period. Chart 1.
Chart 1: GDHI per head at current prices levels in 2018 and average growth from 2008 to 2018 for UK NUTS 1 regions
Source: ONS
A different picture at NUTS 2 level
Looking at NUTS 1 level data in isolation can mask important economic differences within regions. This becomes clear, when looking at slightly more disaggregated regions than NUTS 1 areas, defined by NUTS 2 regions.
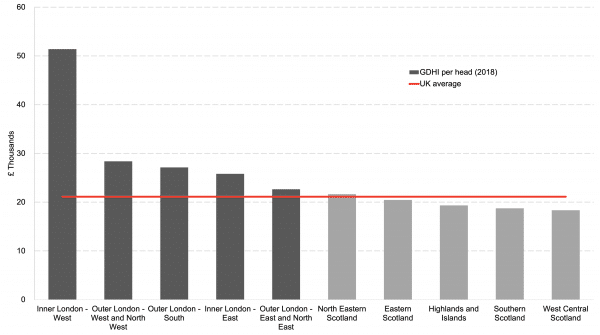
At £51,000 in 2018, ‘Inner London – West’ has the highest income level across all UK NUTS 2 regions. In fact, average incomes in the rest of London are much closer to the richest areas in Scotland than to this outlier. For instance, the income difference between some areas of outer London and eastern Scotland are only around £1,000 per year – while those same areas have incomes that are over £20,000 lower than those in the richest part of London. Chart 2.
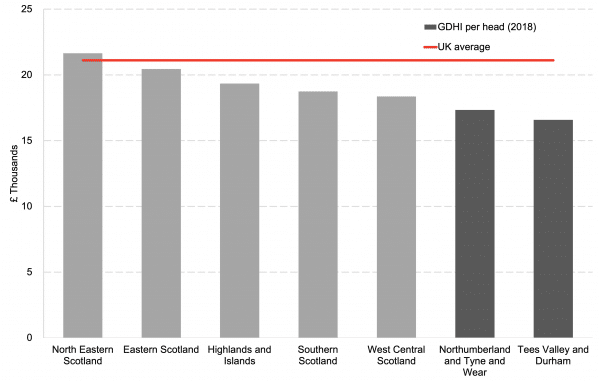
But it is not all roses for Scotland, the poorest areas of Scotland have incomes that are much closer to North East England, one of the UK’s poorest regions, than to the richest parts of Scotland, in the east coast. Chart 3.
Chart 2: GDHI per head for NUTS-2 regions in Scotland and London
Source: ONS
Chart 3: GDHI per head for NUTS-2 regions in Scotland and North East England
Source: ONS
Digging deeper: NUTS 3 regions
Lastly, we move to smallest level of regional aggregation, NUTS 3. Again, we place Scotland, relative to regions within London and North East England.
At this level of aggregation, it becomes clear that some areas of Scotland, such as Edinburgh and Aberdeen, have incomes similar to many parts of London – some Scottish areas even outperform some regions in London. Chart 4.
For Edinburgh, this is driven by a strong financial services sector – similar to London -, while Aberdeen has historically benefitted from its proximity to oil reserves in the North Sea.
Chart 4: GDHI per capita across NUTS 3 regions of London and selected NUTS 3 in Scotland
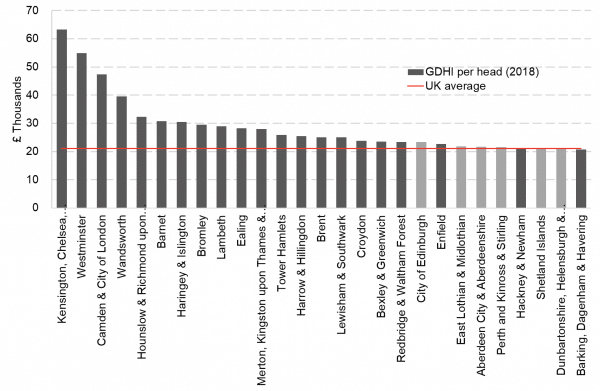
Source: ONS
On the other hand, some parts of Scotland have incomes very close to those in North East England. Glasgow, for instance, has incomes very similar to those in Darlington and Tyneside – both former industrial areas. Chart 5.
Chart 5: GDHI per capita across NUTS 3 of the North East and selected NUTS 3 in Scotland
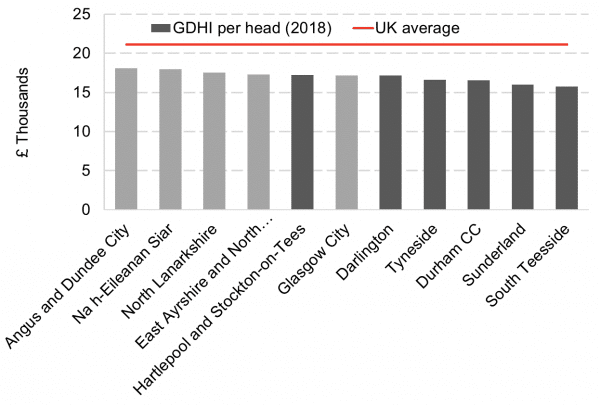
Source: ONS
Policy needs to account for intraregional differences
Among developed nations, the UK has some of the worst regional inequalities, with areas in the South towering over poorer regions in the North.
At first glance, Scotland seems to have incomes roughly in line with the UK average however, once we disaggregate Scotland into smaller regions, a different picture emerges.
There are areas in the East and North East of Scotland, such as Edinburgh and Aberdeen that have levels of income similar to the richest areas in the UK within London. But, at the same time, there are areas, mainly former industrial regions, in the West of Scotland, that have income levels similar to the poorest areas of the UK within North East England.
Policy aiming to reduce regional inequalities needs to be based on granular regional data as there are significant intraregional inequalities that are masked when isolating analysis to more aggregated areas.
Authors

Anton Knoche
Anton is a Research Assistant at the Fraser of Allander Institute. He is also studying for an M.Sc. in Economics from the University of Edinburgh. His research interests cover environmental and political economics, as well as computational macroeconomics.

Adam McGeoch
Adam is an Economist Fellow at the FAI who works closely with FAI partners and specialises in business analysis. Adam's research typically involves an assessment of business strategies and policies on economic, societal and environmental impacts. Adam also leads the FAI's quarterly Scottish Business Monitor.
Find out more about Adam.