
In our June commentary last year, we discussed the negative impact that the Coronavirus pandemic and Brexit had on trade activity.
Since then, despite the easing of coronavirus restrictions and major world economies returning to pre-pandemic levels, global trade continues to struggle with significant disruption for supply chains across the world.
18 months on from the UK’s exit from the European Union and global shortages of materials, given the shutdown of production during several waves of lockdown in the wake of COVID-19, has put serious pressure on global supply chains.
Global supply chains
Despite a continued easing of the significant pressures experienced at the end of 2021, the Global Supply Chain Pressure Index (GSCPI) remained at near record high levels in May, see Chart 1.
The continued pressures experienced in the global index were primarily driven by outbound trade from Asia and also UK backlogs, despite improvements across the majority of other indicators.
The ongoing Ukraine-Russian conflict also continues to hamper trade across Europe, with delivery times in the euro area placing greater strain on supply chains.
Chart 1: Global Supply Chain Pressure Index, January 2000 – May 2022
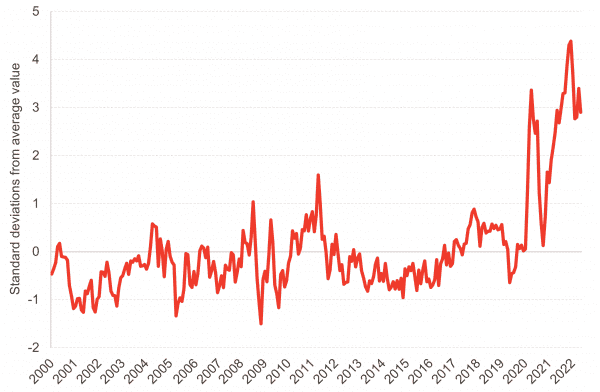
Source: Federal Reserve Bank of New York
However, despite the pressure on global supply chains, export of goods continues to grow across the majority of major economies.
Exports of goods from the US continued to grow at higher levels than other major economies, up 18% in March 2022. Average growth across other major economies was roughly 4%, far slower growth than experienced in April of last year.
Chart 2: Exports, major global economies, January 2020 – March 2022
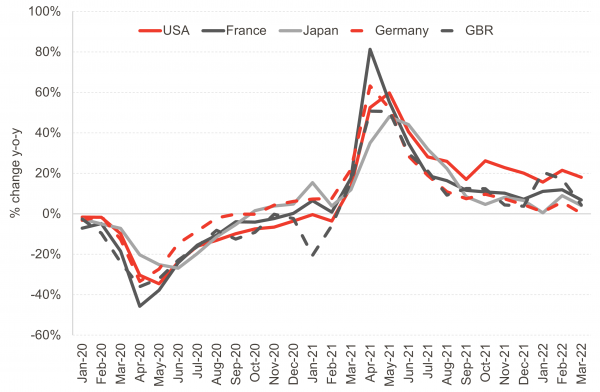
Source: OECD
How has the UK been affected?
The latest UK trade data suggests that total monthly exports grew by 7% between March and April, up 12% on the previous year.
In the past year, both exports to the EU and RoW have remained at very similar levels. In recent months however, EU exports have remained slightly higher, with the value of exports higher than the RoW figure for the third consecutive month, see Chart 3.
Chart 3: UK monthly exports at current prices, January 2010 – April 2022
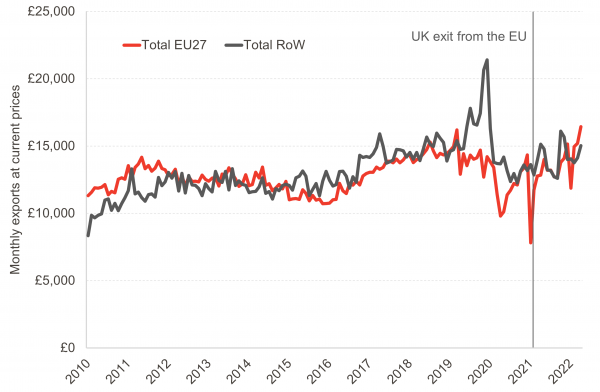
Source: ONS
As well as recovery in exports in the past few months, imports to the UK have also continued to grow and recover.
Growth in imports remained at some of its highest levels since the beginning of 2010, with growth in imports of 35% since February 2020, see Chart 4.
Chart 4: UK monthly imports index, January 2010 – April 2022
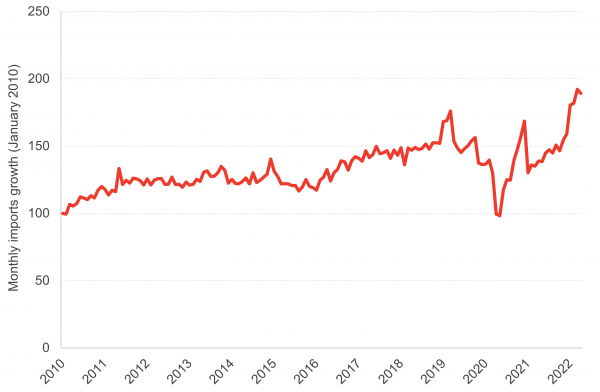
Source: ONS
The implications of disrupted trade flows
As mentioned in our outlook and appraisal section, the input producer price inflation (PPI) rate rose 22.1% in the year to May 2022, a 1.2 percentage point increase on the previous month.
This rise was significantly higher than the output PPI rate of 15.7% in May, the 17th consecutive positive output PPI rate.
Growth in the input PPI rate was primarily driven by the surge in price of metals and non-metallic minerals, with annual price growth of 24.1% in May 2022, contributing 4.89 percentage points to the overall input PPI.
As well as this, crude oil also contributed significantly – 4.4 percentage points – highlighting that similar to consumers, producers are incurring huge costs for fuel and energy, see Chart 5.
However despite oil, and subsequently fuel and energy driving price hikes for inputs, the cost of food provided the highest contribution to the annual output PPI rate, 3.47 percentage points, see Chart 6.
Food products experienced annual growth of 10.4% in May 2022, the highest annual rate since September 2008, given the sharp price rises in the preserved meat and meat products market.
The UN’s global food price index [1] also indicated high prices in food markets globally, with the indicator averaging 157.4 points in May 2022, a fall in prices on April of 0.9 percentage points, but still a 29.2 percentage point increase on May 2021.
Chart 5: Growth in input producer price inflation rate by component, 1 month and 12 month rate
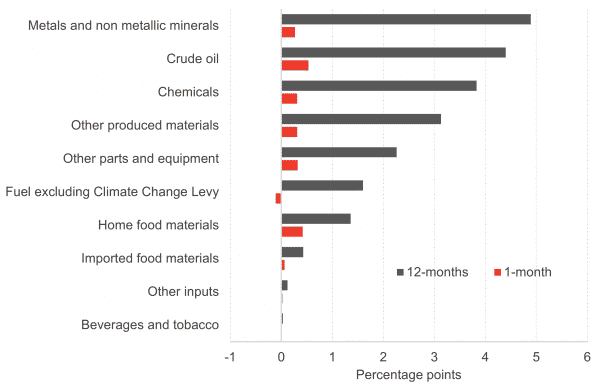
Source: ONS
Chart 6: Growth in output producer price inflation rate by component, 1 month and 12 month rate
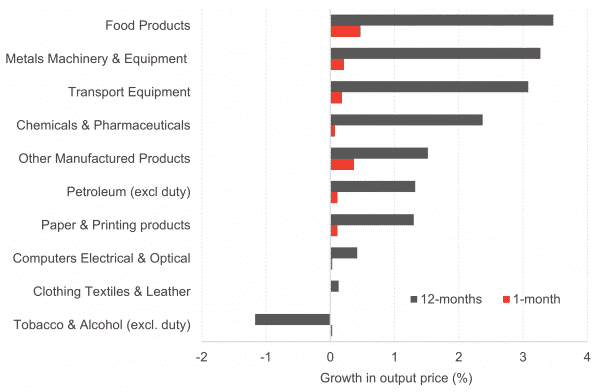
Source: ONS
Whilst the expectation is that the increases in producer prices at the ‘factory gate’ could further increase consumer prices, the growth in the input PPI rate shows that at the opposite end of the supply chain, availability of materials and goods is what is pushing costs up, particularly as demand increases.
Flexport’s Ocean Timeliness Indicator shows this disruption in international shipping times with a shipping container on the Trans-Pacific route to US from Asia taking 99 days, a trip that took only 50 days at the beginning of 2020, see Chart 7.
This suggests that until international shipping returns to its pre-pandemic levels, if it does at all, and demand only continues to rise, it may be a while before we see any cooling in input prices for producers.
Chart 7: Flexport’s Ocean Timeliness Indicator, Days taken from ‘cargo ready’ to the destination port, 1st January 2020 – 12th June 2022
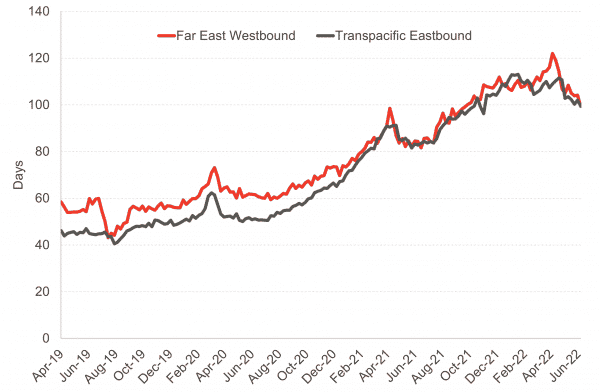
Source: ONS
In order to overcome the ongoing supply chain disruption, many UK manufacturers have moved to reshore their production.
The current state of international trade flows means many business have looked closer to home, particularly those operating under just-in-time processes, who are now mitigating any risks by moving away from some of their offshore supply and sourcing domestic materials.
Many of these firms have also looked to move away from reliance on Asian suppliers given extensive lead times, and instead use UK based suppliers.
A recent survey by Make UK, an independent trade body for engineering and manufacturing in the UK, suggested that 75% of firms had increased their use of British suppliers in the past two years, with just under half planning to increase UK supply in the coming two years [2].
Their results suggested that around 40% of reshoring had come from China, and over 30% from Eastern Europe.
What can be done?
What the ongoing disruptions have taught us however is that there is an opportunity to rethink trade policy, particularly as manufacturers and suppliers slowly reverse the decades long move to offshore supply.
The recent launch of The Centre for Inclusive Trade Policy aims to aid this process. The centre is the first solely dedicated to trade policy and is funded by the Economic and Social Research Council (ESRC).
The centre is built on the idea that trade policy should be inclusive in both policy formulation and outcome and focuses on four dimensions of inclusiveness: geography, political domains, society and generations.
In addition, the Centre itself is inclusive with researchers in all four UK nations, in five disciplines and at all stages of their careers, with a commitment to hear the voices of all parts of UK society.
This article is part of our Fraser of Allander Economic Commentary Q2 2022.
[1] The UN Global Food Price Index is a measure of monthly change in international prices of a basket of food commodities including cereal, vegetable oils, dairy, meat and sugar.
[2] See Financial Times
Authors

Mairi is the Director of the Fraser of Allander Institute. Previously, she was the Deputy Chief Executive of the Scottish Fiscal Commission and the Head of National Accounts at the Scottish Government and has over a decade of experience working in different areas of statistics and analysis.

Ben is an Economist Fellow at the Fraser of Allander Institute working across a number of projects areas. He has a Masters in Economics from the University of Edinburgh, and a degree in Economics from the University of Strathclyde.
His expertise lies in various economic modelling approaches, social care, and evaluating social impact for organisations across the private, public and third sector, particularly where evaluation requires intuitive approaches.