In recent months we have seen relatively strong headline labour market indicators in both Scotland and the UK.
But this only tells part of the story. The types of jobs being created, the levels of security and prospects they provide, and crucially the earnings received are just as important.
UK data has shown that the strong growth in employment has been accompanied by a squeeze in real earnings.
Data on earnings for Scotland is much harder to come by. But this week we had the latest Annual Survey of Hours and Earnings (ASHE) publication which gives some insight into earnings in Scotland.
This blog summarises the headline results for April 2017 and what they could be telling us about the health of the Scottish labour market.
Why is earnings data important?
Earnings data is important for a number of reasons.
Firstly, it matters for the labour market and household incomes. People might be in work, but if their earnings are being squeezed – either through weak growth in their pay awards or inflation – then it can mean that outcomes are less positive than they would seem at first glance.
Secondly, with Holyrood’s budget now much more dependent upon how Scottish per head income tax receipts do vis-à-vis the rest of the UK, the performance of Scottish earnings relative to the UK is no doubt something that the Scottish Fiscal Commission will be keeping a keen eye on.
Last year’s GERS report estimated that income tax receipts per head grew 0.9% in Scotland compared to 1.5% in the rest of the UK.
Ultimately, income tax receipts in any given year will be determined by a number of factors. The correlation between economic performance and tax revenues is never perfect, at least in the short-term.
That being said, with Scotland in control of the tax component from earned income (i.e. non-savings non-dividend income tax), how Scottish earnings are holding up will undoubtedly influence the outlook for future growth.
One measure of earnings growth is the ASHE data – published here. This is an annual survey of earnings across the UK. It is typically the official source used to assess trends in earnings across the UK. It does have some weakness however. In particular, estimating the earnings of the richest workers is exceptionally difficult – and subject to a high margin of error – as they may take ‘earnings’ in a variety of forms (e.g. dividend payments and accumulation of different forms of wealth). ASHE also excludes people who are self-employed (a growing number of people).
So what do the latest data tell us?
Last year’s ASHE earnings data showed weak growth in Scotland, compared with the UK as a whole.
Median earnings grew by 1.5% in Scotland compared to 2.2% in the UK as a whole between April 2015 and April 2016.
Not only did this gap hold at the median level but it also was evident across different income levels. For example, amongst the highest earners (key in terms of raising revenue) UK growth was 2.2% compared with 1.5% in Scotland.
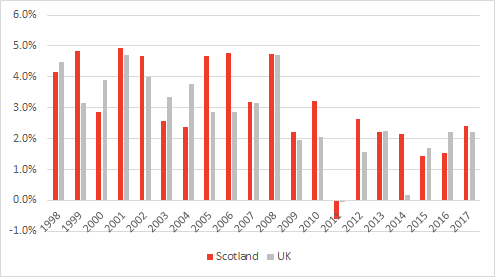
But last week’s data for April 2017 looks slightly better. Scottish median gross weekly earnings for full-time employees grew by 2.4% in the past year – slightly faster than growth of 2.2% in the UK as a whole. The chart below looks at Scottish earnings growth relative to the UK over a longer time horizon, and shows that Scotland has had higher median earnings growth than the UK in most years since devolution.
% growth in median weekly earning, 1998-2017
Looking more deeply at the data also reveals some interesting results. In the latest data earnings in 8 out of 10 deciles have grown faster in Scotland than the same part of the income distribution in the UK as a whole, as the table below shows.
UK, Scottish median gross weekly pay, and % growth by percentile: April 2017
| Percentiles | ||||||||||
| 10 | 20 | 25 | 30 | 40 | 60 | 70 | 75 | 80 | 90 | |
| UK pay | 319.7 | 372.8 | 400.0 | 428.6 | 484.8 | 628.7 | 720.8 | 774.8 | 846.1 | 1,092.4 |
| Scottish pay | 322.7 | 374.4 | 401.5 | 429.3 | 483.3 | 617.6 | 688.7 | 743.7 | 804.9 | 1,011.8 |
| UK Growth | 3.5% | 2.7% | 2.8% | 2.4% | 2.0% | 2.5% | 2.3% | 1.6% | 2.4% | 3.2% |
| Scottish Growth | 3.7% | 2.9% | 3.1% | 2.9% | 2.3% | 2.6% | 0.9% | 2.7% | 3.3% | 2.7% |
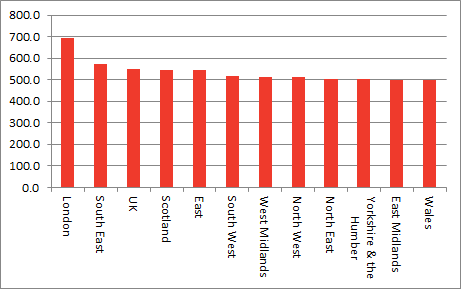
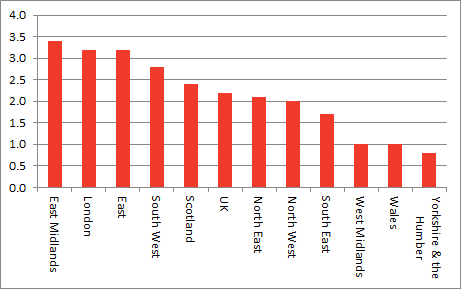
And in comparison to other UK regions in April 2017, Scotland had the 3rd highest median weekly earnings and the 5th highest growth in average weekly earnings.
Median weekly earnings by UK region April 2017, £
Percentage Growth in weekly earnings by region, April 2016-April 2017
Bigger picture for workers, households and the wider economy
So relative to the UK as a whole – and different parts of the UK – Scotland’s performance on earnings in 2017 holds up well.
But it is important not to get too carried away with this.
Firstly, with inflation running at 3%, many workers are still seeing their purchasing power being eroded quite substantially.
Secondly, the employment data does suggest that the labour market in Scotland continues to tighten. High employment, growing wages and – as we are seeing in surveys such as the most recent Scottish Chambers of Commerce Business Survey – increased difficulties in recruiting staff are all consistent with this.
Clearly high employment is positive. But with growth still weak in the economy overall this suggests that productivity continues to be squeezed and that the scope for a sharp bounce back in growth and quick return to trend is increasingly remote.
Authors
The Fraser of Allander Institute (FAI) is a leading economy research institute based in the Department of Economics at the University of Strathclyde, Glasgow.


