Early last month HMRC published new regional trade statistics for 2017 by region and nation of the UK.
In this blog, we look at these data and highlight some interesting trends and issues.
Caveat on these data
Before looking in detail, and with a nod to the debates that trade data can provoke in Scotland, something to keep in mind:
There are three main sources of export statistics data for Scotland.
The first is ‘Export Statistics Scotland’ published by the Scottish Government; the second is UK Regional Trade Statistics – published by HMRC (for goods) and the third is by the ONS (for services).
The UK regional statistics produced by HMRC and ONS take UK-wide data and apportion it according to business address. Where a firm has multiple locations, an employment share is used.
Crucially, following a change in methodology a couple of years ago, the HMRC allocates oil exports from North Sea platforms to a particular part of the UK. In the past, it was included as an ‘unknown’ region.
Of course, there have in the past been debates about the inclusion (or omission) of the oil figures in the Scottish series. Irrespective of your views on this, it is clearly the case that how – and where to – oil is piped or shipped is quite different from what most economists and businesses would view as a normal ‘goods export’. For many, the goods we talk about are products designed and made in a country by business rather than simply where an offshore natural resource is landed.
The Scottish Government export data does not include these oil exports.
All three datasets use the final destination market. Therefore, even if a Scottish product leaves from a port elsewhere in the UK they will still be counted as a ‘Scottish export’. However, they do not monitor cross border flows of complex supply chains.
What does the latest HMRC trade in goods data show?
For Scotland, the data show that international goods exports were valued at £28.8bn in 2017, up from £24.2bn in 2016, while international goods imports increased in value from £21.6bn to £24.2bn.
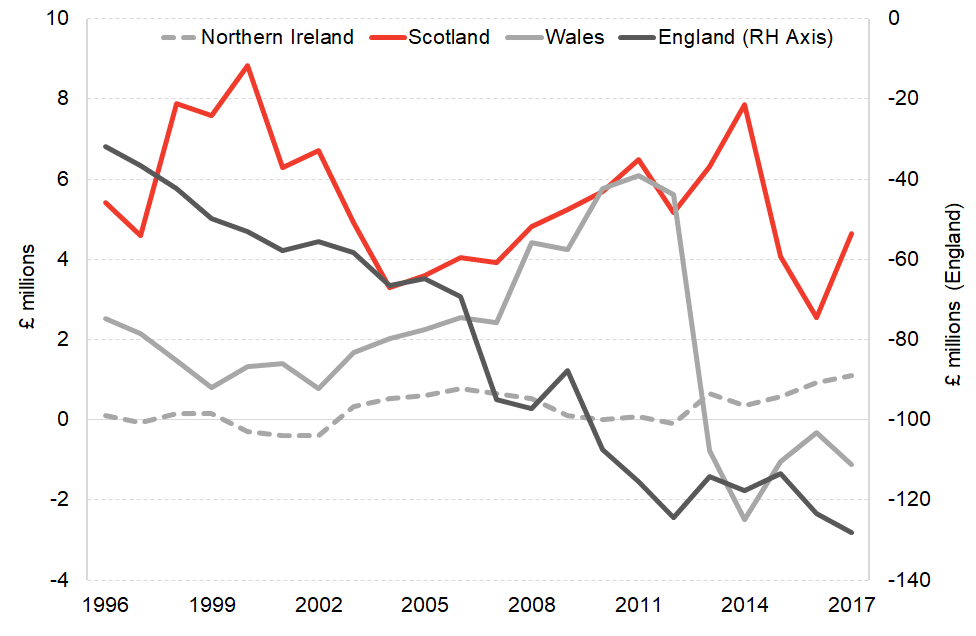
Comparing across nations of the UK one interesting result is that both Scotland and Northern Ireland have international trade in goods surpluses (that is the value of goods exports exceeds the value of goods imports).
In contrast England runs a substantial international trade in goods deficit.
Trade surplus/deficit by nation of the UK
However, as we noted earlier, the HMRC only records goods traded – not services – and is therefore only a partial assessment of the international trade balance. And of course, the data doesn’t capture trade with the rest of the UK (where the Scottish Government data shows a substantial trade deficit).
So what is driving this increase in Scotland’s goods trade surplus?
The HMRC data are useful in allowing us to break trade up in terms of destination.
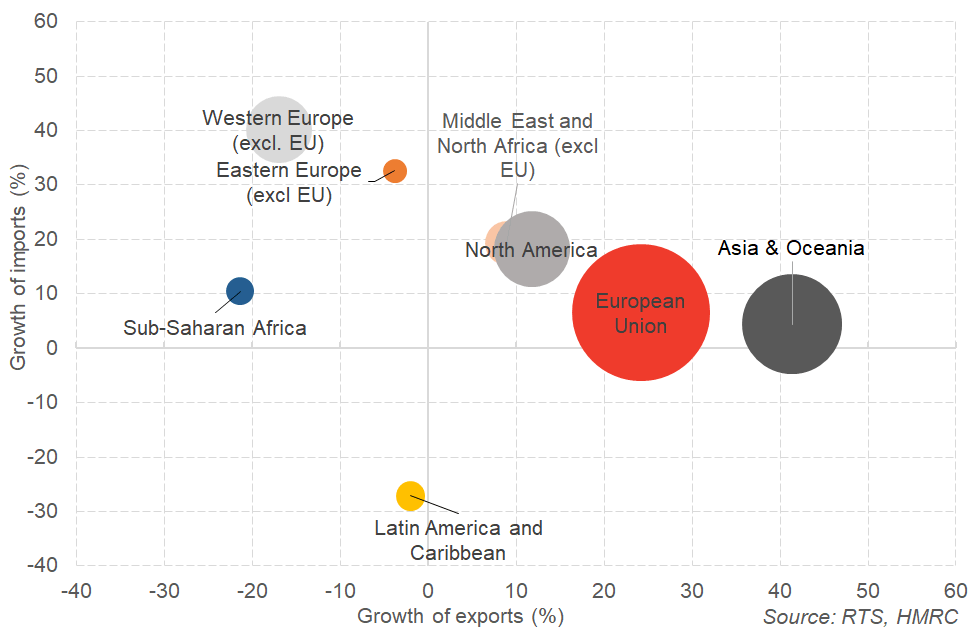
The chart below shows how exports and imports changed from 2016 to 2017, as well as showing which regions dominate Scotland’s trade (in terms of total trade) via the size of the bubble. EU and Asia & Oceania are the largest export markets for Scotland and have seen the most rapid growth in 2017.
Growth of Scottish imports/exports by source/destination (size of bubbles show total value of exports plus imports)
Growth in type of good traded
Aside from telling us about who we trade with, and how they have grown, the HMRC data are also useful in highlighting what we are trading.
Over the past year there has been an increase in the exports and imports of all aggregate commodity groups. Some commodity groups have experienced rapid growth. This might reflect the competitive boost experienced since the fall in the value in Sterling (although we need to bear in mind that these data are in cash terms and do not take into account inflation).
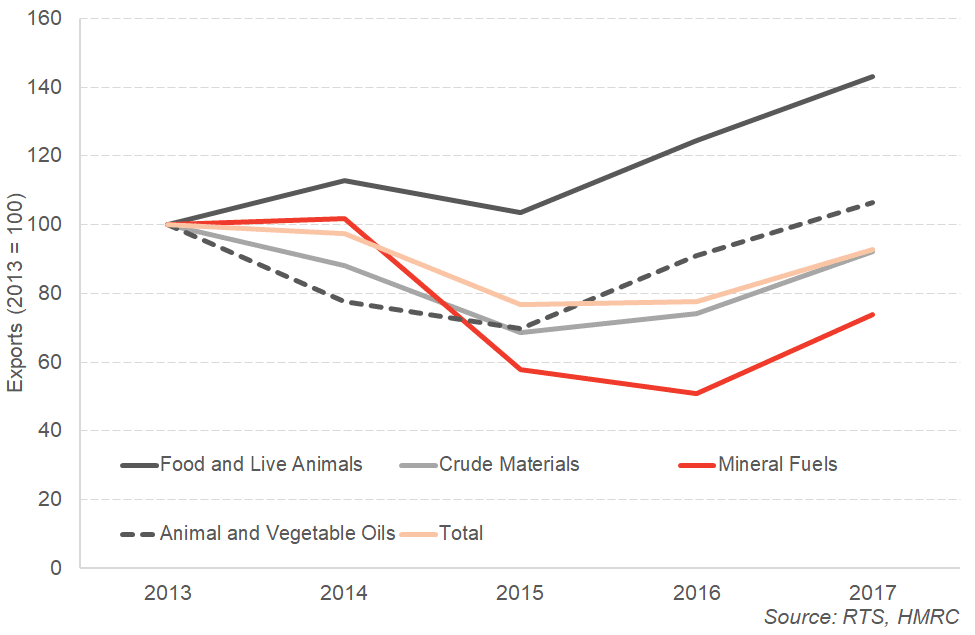
Among those commodity groups which have experienced the sharpest increase in exports recently, a number have export values below those in 2013. So whilst we have seen recent growth, we’re – in cash terms – exporting less than we were in 2013. The main exception is ‘Food and live animal’ exports.
Scottish Exports by commodity 2013-17
Changes to offshore outputs seem to be have a particular strong impact on the results. 2017 saw an increase of 45.1% in the value of ‘Mineral fuels’ exports, and a 24.3% increase in ‘Crude materials’ exports.
Within ‘Mineral fuels’, 96.7% of the increase is attributable to exports of ‘Petroleum, petroleum products & related materials’.
The scale of this increase is significant.
Indeed the increase in exports of the petroleum sector represents nearly 58% of the increase in total export volumes in Scotland in 2017.
That naturally raises a number of questions. Firstly, where are we exporting this offshore oil to, and secondly, without this trade and given the rather unique nature of this export product, what would our trade balance be?
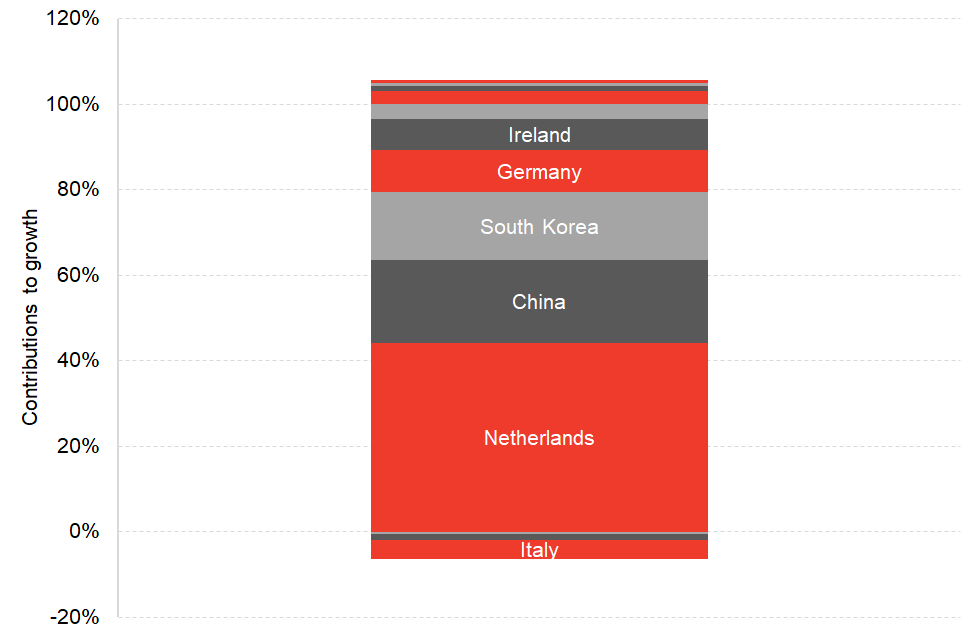
The chart below shows that much of the growth is driven by increasing export volumes to the Netherlands, China and South Korea
Contributions to export growth
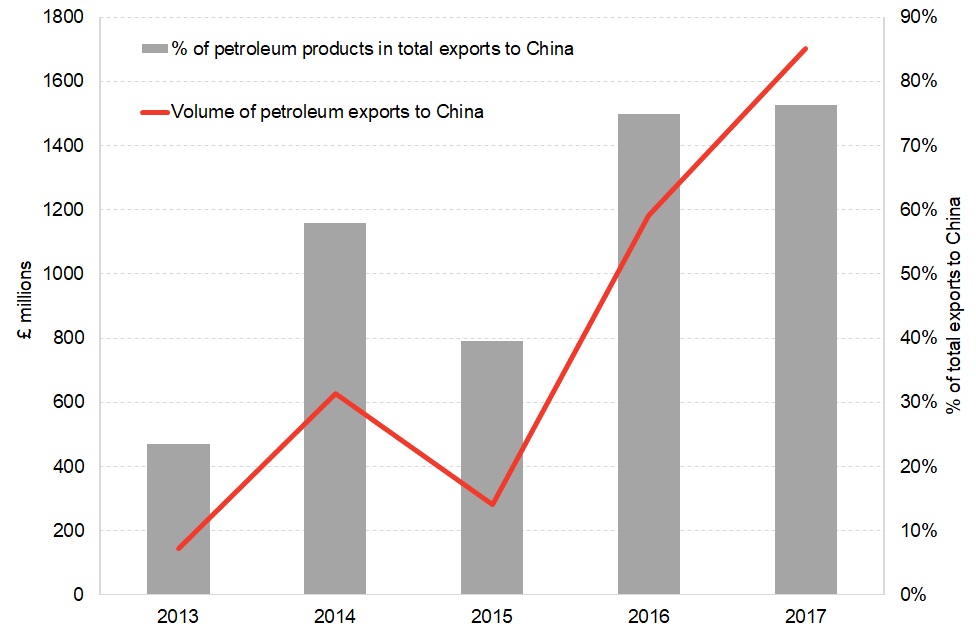
The chart below emphasises how important exports of petroleum to China have been. These now account for over 75% of the total volume of exports from Scotland to China.
Petroleum exports to China in volume and as a proportion of total exports to China
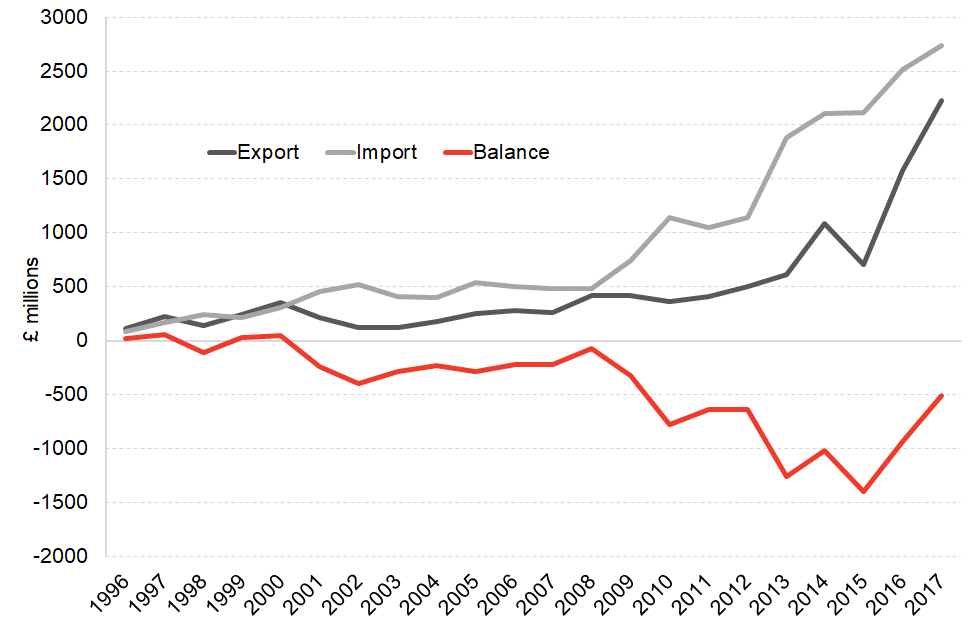
Growth in exports to China are particularly interesting when compared to the Scottish Government Export Statistics Scotland Data which has exports to China (goods and services, not just for petroleum) at just £555m in 2016 – or around ¼ of that shown in the HMRC data.
Scotland’s trade with China
That Scotland is ‘exporting’ so much of its offshore oil production to China will come as a surprise to many.
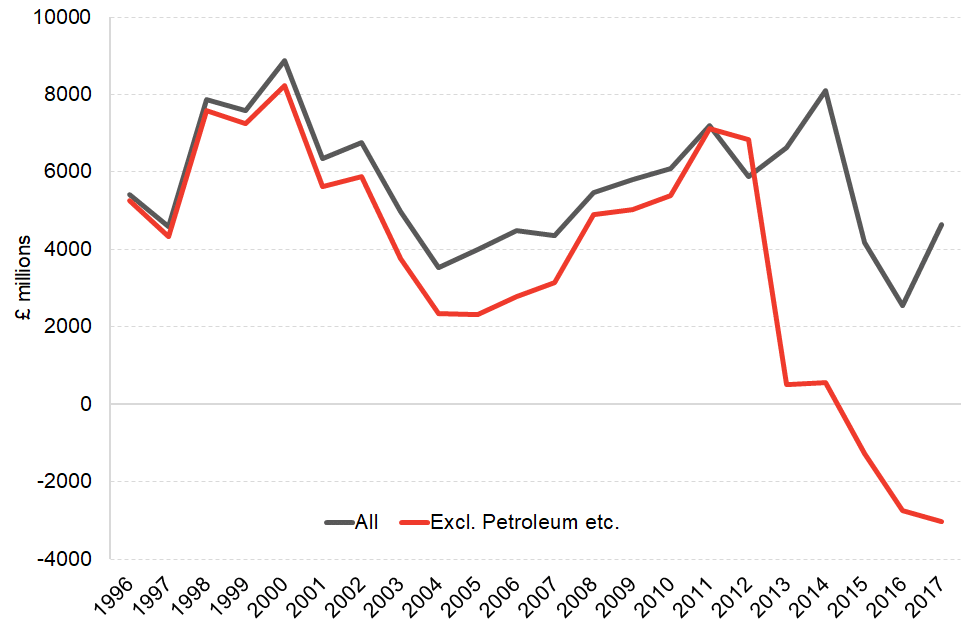
On the second question, we can see in the chart below how important this sector is driving Scotland’s trade surplus in goods.
In their absence, Scotland would have a trade deficit in goods.
Scotland’s international trade balance with and without Petroleum
Conclusion
This blog has outlined some interesting results from the recent HMRC trade data.
It is clear that on the headline measures Scotland appear to be doing well in growing its international good exports.
However, much of the growth – and in turn the trade surplus in goods – appears to be driven by where offshore petroleum and petroleum products are being landed (or apportioned to). In particular, the recent data shows a sharp increase to a small number of countries including the Netherlands and China.
The HMRC data is useful as it provides helpful information on a subset of Scotland’s export performance but we’d urge caution in reading too much into the data without a wider acknowledgment of the individual components of these ‘goods’, the importance of services exports and Scotland’s trade with rUK.
Authors
The Fraser of Allander Institute (FAI) is a leading economy research institute based in the Department of Economics at the University of Strathclyde, Glasgow.
