Today sees the publication of the latest Government Expenditure and Revenue (GERS) report.
This blog summarises some of the key headline results.
What is the headline figure?
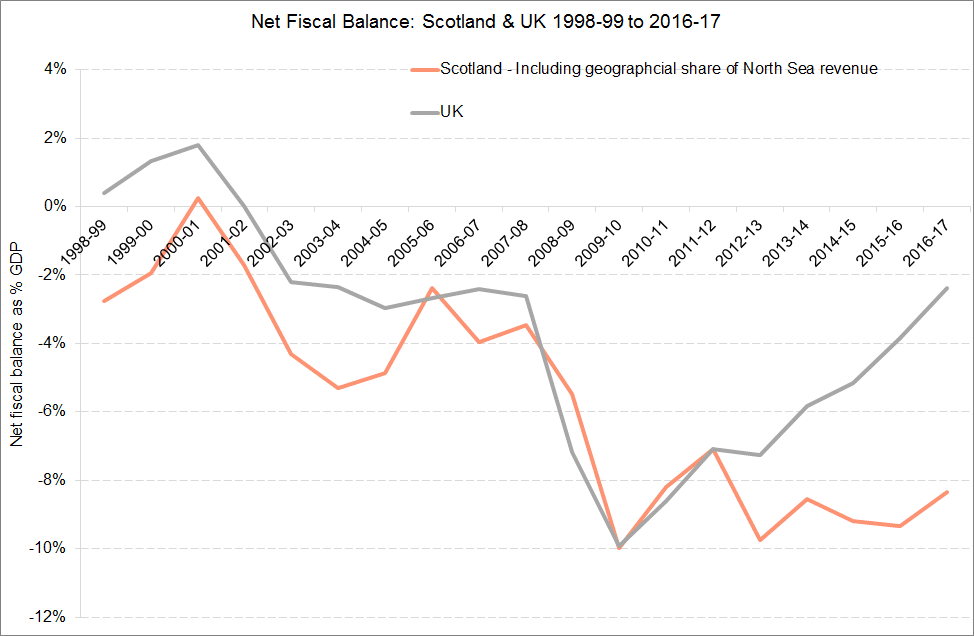
The GERS report shows a net fiscal balance (including a geographical share of North Sea oil) in Scotland of -£13.3bn or -8.3% of Scottish GDP for 2016-17. This compares with a UK balance of -£46.2bn or -2.4% of UK GDP.
This is an improvement on the figures for 2015-16 where Scotland’s fiscal balance was -9.3%.

As we outlined in our blog here, given the outlook for the UK public finances, Scotland’s net fiscal position is projected to improve over the next few years. But – based on the latest assessments of the outlook – it will remain higher than that for the UK and settle at between 6% to 7% of Scottish GDP by 2019-20.
How does this compare to previous years?
As the chart highlights, Scotland had a relatively stronger fiscal position than the UK back in 2010-11.
But since then, this relative position has been reversed.

Today’s relative gap of 6% points (-2.4% vs. -8.3%) is the largest relative gap in the notional Scottish and UK deficit since the GERS figures were published on a consistent basis back to 1998-99.
The key reason for this shift to a weaker relative performance and that’s the fall in oil revenues. Scottish oil revenues were as high as nearly £8bn in 2011-12 but are now just £200m according to today’s publication.
Back in March 2013, the OBR were forecasting oil revenues of £4.8bn for 2016-17. In March 2013, the Scottish Government forecast oil revenues of between £4.2bn and £10.7bn for 2016-17.
For a variety of reasons, oil revenues have turned out to be much lower than most anticipated. Given the importance of such revenues to the GERS figures, this has a major bearing on the Scottish relative position.
Unfortunately, the outlook for oil revenues isn’t likely to change any time soon.
Why does the GERS methodology show Scotland having a larger negative net fiscal balance than the UK as a whole?
There are two reasons.
Firstly, according to the GERS methodology Scottish tax payers raise slightly less per head than the UK average – in the latest year this was equivalent to around £300 per head.
Secondly, spending per head for Scotland is quite a bit higher than for the UK – a difference of around £1,400 per head in 2016-17.
What about Scotland’s position compared to other UK nations and English regions?
GERS only covers Scotland and the UK. We know that the UK economy is highly unbalanced. For example, GDP data shows that areas like London and the South East are much wealthier than other parts of England – see here.
So it is interesting to see how Scotland is placed relative to other parts of the UK.
A recent ONS publication estimated the fiscal balances for the 12 Government Office Regions of the UK – that is, Scotland, Wales, Northern Ireland and the English Regions.
The figures are experimental and still in development. They cover up to the year 2015-16 (so 1 year behind today’s GERS figures). It’s important to note that there will always be some minor methodological and data differences between GERS and this report.
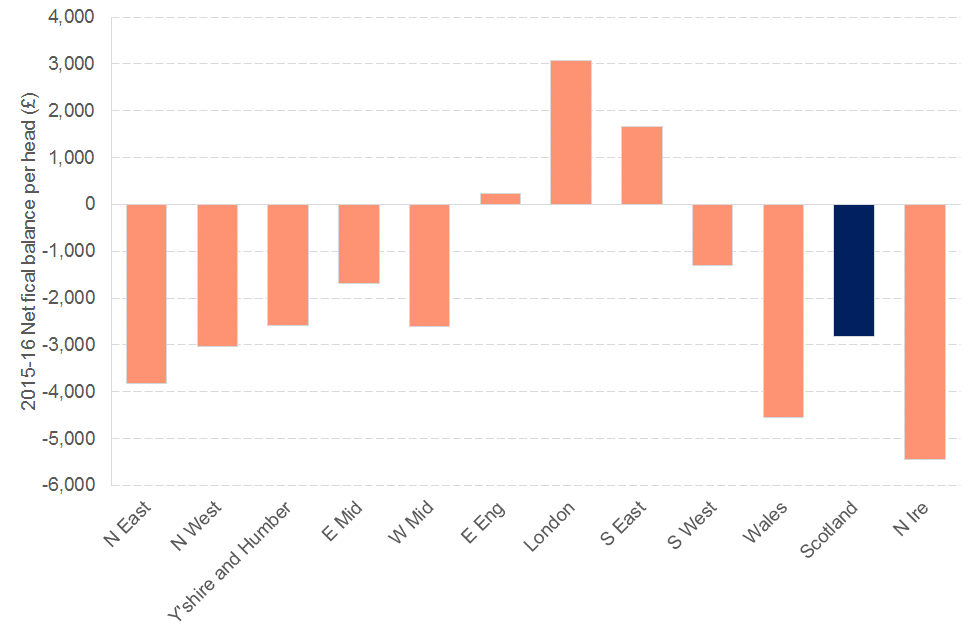
The chart below shows the net fiscal balances per head for 2015-16.
For 2015-16, according to the ONS methodology, Scotland’s net fiscal balance per head was -£2,824. The equivalent UK figure was -£1,108.
Wales, Northern Ireland, the North West and the North East were estimated to have larger negative fiscal balances per head than Scotland. All the other parts of the UK had a relatively stronger position.
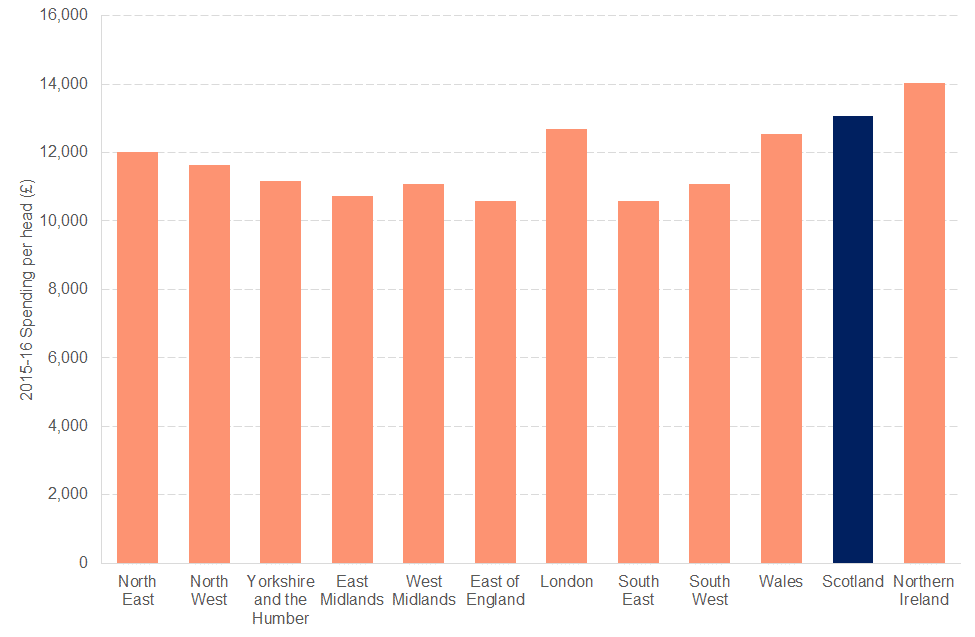
The key reason for Scotland’s ranking behind other parts of the UK is not because of lower revenues, but higher levels of spending. Indeed only London, the South East and the East of England are estimated to raise more revenue per head than Scotland.
But as the chart highlights, (alongside London) Scotland has the highest levels of spending per head outside of Northern Ireland.
Final thoughts
It is important to remember that GERS takes the current constitutional settlement as given. If the very purpose of independence is to take different choices about the type of economy and society that we live in, then a set of accounts based upon the current constitutional settlement and policy priorities will tell us little about the long-term finances of an independent Scotland.
But GERS does provide a pretty accurate picture of where Scotland is in 2016-17. In doing so, it sets a useful starting point for a discussion about the immediate choices and challenges that need to be addressed by those advocating further constitutional change.
All countries face big fiscal challenges in terms of what will replace declining revenues in the face of rising spending pressures over the next few years.
Changing the constitutional set-up doesn’t alter the fact that these fiscal challenges need to be addressed by all governments in all countries. Today’s figures show that a more autonomous Scotland will be forced to meet such challenges sooner rather than later.
Authors
The Fraser of Allander Institute (FAI) is a leading economy research institute based in the Department of Economics at the University of Strathclyde, Glasgow.

Graeme Roy
Dean of External Engagement in the College of Social Sciences at Glasgow University and previously director of the Fraser of Allander Institute.


