
Later this year, Glasgow hosts the COP26 meeting, bringing together international leaders to address climate action towards meeting the 2015 Paris Agreement targets.
While the focus of the discussions will be on policies to deliver emissions reductions at scale and rapidly to meet these climate goals, the choices made will have significant economic impacts and implications. Indeed, all aspects of our economy will be impacted by the move to net zero. As a recent example, the report of the Just Transition Commission sets out the challenges across all layers of policy to ensure that the rapid transition to a zero carbon economy is fair and equitable.
As host city, Glasgow has an opportunity to lead on its strong climate principles, including building on its 2019 declaration of being a carbon neutral city by 2030. Cities across the world have set out their willingness to play a major in climate action, bringing their significant economic scale, practical experience and knowledge from their localities and their arguable nimbleness compared to national governments (C40, 2018).
In ongoing research, we seek to understand Glasgow’s current emissions levels – and the challenges for economic planning – by linking emissions to measures of economic activity.
By placing emissions alongside economic accounts, we can undertake initial and illustrative environmental accounting. These accounts will help shed light on the important economic dimension of Glasgow’s low carbon transition.
Specifically, we bring together data on emissions, energy consumption and a newly developed set of economic accounts for the Glasgow City Region (GCR) (Note, where we discuss Glasgow through this note, we are specifically referring to this Glasgow City Region definition.)
In this first article, we look at three things.
First, how are Glasgow’s emissions measured in UK statistics, and what do the data say about recent trends?
Second, how do these emission figures relate to other emissions metrics, including those for cities around the world (such as here and here), and to other (arguably better-known) measures, such as territorial emissions and carbon footprints which are available for Scotland. In this, we will outline difference in definitions, both the two mentioned above and the widely used categorisation of Scope 1, 2 and 3 emissions, drawing on the work of Wiedmann et al (2020).
Third, we bring our own data to the story. We can identify the connections between economic activity, energy consumption and (industrial territorial) emissions in Glasgow. By using existing data, we can see both the challenges to decarbonisation, and the extent to which gaps in data or the coverage of current metrics might exist.
What are the trends in Glasgow’s emissions?
Figure 1 shows the (total) reported CO2 emissions for the local authorities (LAs) which make up the GCR, from data published by the UK Department of Business, Energy and Industrial Strategy. The latest dataset covers 2005 to 2018 and was published in June 2020.
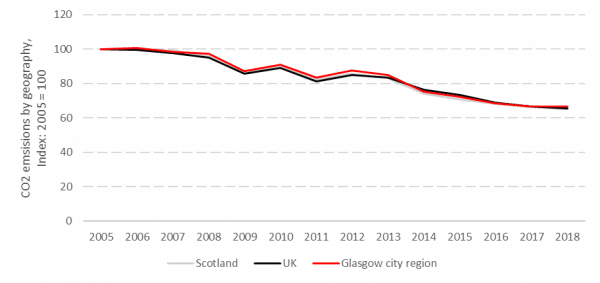
Under this measure, emissions from all local authorities within the Glasgow City Region reduced over this period. Alongside the absolute reduction, we can see a similar trend in % reductions for GCR, Scotland and the UK as a whole (from this same dataset) in Figure 2. As of 2018, Glasgow City Region has cut emissions by around 1/3 since 2005.
These percentage reductions look unusually similar and suggests that we need to look at how the metric is put together.
Figure 1. Glasgow City Region CO2 emissions by Local Authority between 2005 and 2018.
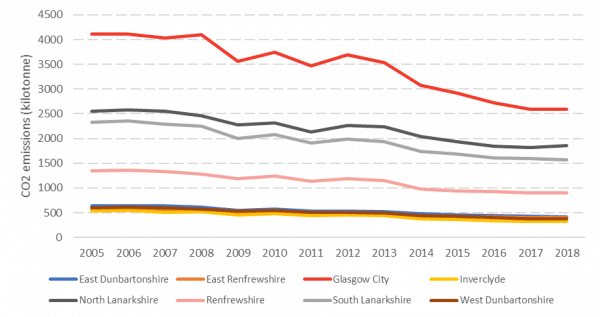
Figure 2. CO2 emissions relative to 2005 by geographic grouping, 2005 to 2018
What is measured in these emissions data?
The BEIS emissions dataset reports CO2 emissions on an “End User” (EU) basis, meaning emissions for each local authority are based on estimated energy/fuel use within its borders.
Emission by Industries, Agricultural, Land Use and Transport are based on estimated economic structure and energy use, by fuel. The end user model reallocates emissions from energy supply industries to each energy use sector in proportion to the amount of energy used by each sector.
Household energy use is linked to gas and electricity consumption at the local authority level. Energy use is then converted into emissions using common emissions factors (i.e. these are held constant per use of fuels and so emissions by area will vary with fuel use). Electricity consumption by LA (produced by BEIS) is converted to CO2 emissions by multiplying electricity consumption by a CO2 emissions factor based on the UK’s electricity generation mix. Estimates of emissions of gas use by LA are treated similarly.
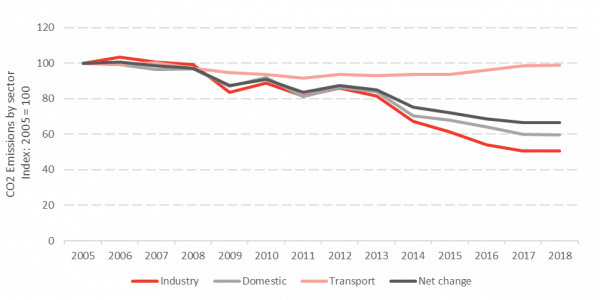
The major categories at which emissions are reported include Industries, Domestic, Agricultural, Transport and Land Use. By looking at these sectors, the significant driving factor of the observed change is the decarbonisation of the electricity generation mix. The end user approach attributes the impact of decarbonisation to the consumers of electricity, principally the Industrial and Domestic sectors, and we can see a sharp decline relative to the other categories (Figure 3).
Figure 3. CO2 emissions in GCR by broad sector grouping, 2005 to 2018
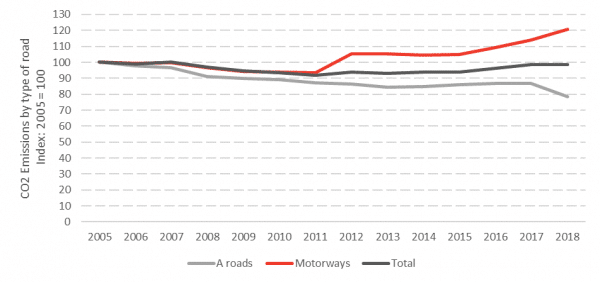
Contrary to emissions from electricity consumption, we can see a much smaller reduction in emissions from transport. It appears from the data that this is driven by emissions along motorways (Figure 4). There appears to have been a reduction in emissions from vehicles on A roads but there has also been an increase in emissions from motorways (the extension to the M74 joining the M8 was completed in 2011 and perhaps explains the sharp increase in that year).
Interestingly, in the end use method, emissions from transport are based on an estimate of the distance travelled by vehicles within a local authority and information on the vehicle stock and its emissions intensity. The use of roads within the GCR area boundaries therefore gives rise to emissions attributed to the city irrespective of the start or end point of the journey, place of residence of the driver, or the specific characteristics of the vehicle fleet within the local authority.
Figure 4. Components of transport emissions in GCR area, 2005 to 2018
Other emissions metrics
Having seen the changes in emissions reported for the GCR under the current measuring approach – which we label as “end user”, it might be useful to compare these to other published metrics – production (“territorial”) emissions and consumption (“footprint”) emissions.
Production is perhaps the most commonly used metric, as it relates to the amount of emissions produced within the geographic area. Scotland’s emissions are reported under this metric on an annual basis here.
Contrary to the end user method, territorial emissions are recorded against the specific area in which they are produced. For instance, emissions from electricity generation in Scotland are allocated to Scotland, and not where Scottish electricity is consumed (as would be the case in the “end user” method).
From a territorial perspective, the decarbonisation of Scotland’s electricity mix shows up significantly, while there is a more muted change in the emissions intensity of GB electricity mix. Recall, this second element is what is used to attribute emissions to electricity consumption at the local authority level.
Consumption-based emissions on the other hand, show the quantity of emissions which take place anywhere in the world to satisfy the consumption of goods and services in a particular area. Scotland’s carbon footprint is reported annually here.
From a GCR perspective, the critical distinction here is to do with where goods which are consumed in GCR are produced. For local consumption of local production, this is straightforward. For those items which are produced across the world and consumed in GCR, a consumption-based perspective would show the global level of emissions which are sustained to meet Glasgow’s consumption. A corollary would be that goods produced in Glasgow and which are consumed elsewhere – such as exports – would be allocated to the consuming region.
Indeed, when looking at emissions at the city level, the distinction is often made between Scope 1, Scope 2 and Scope 3.
Figure 5. Comparison of alternative emissions metrics at city level
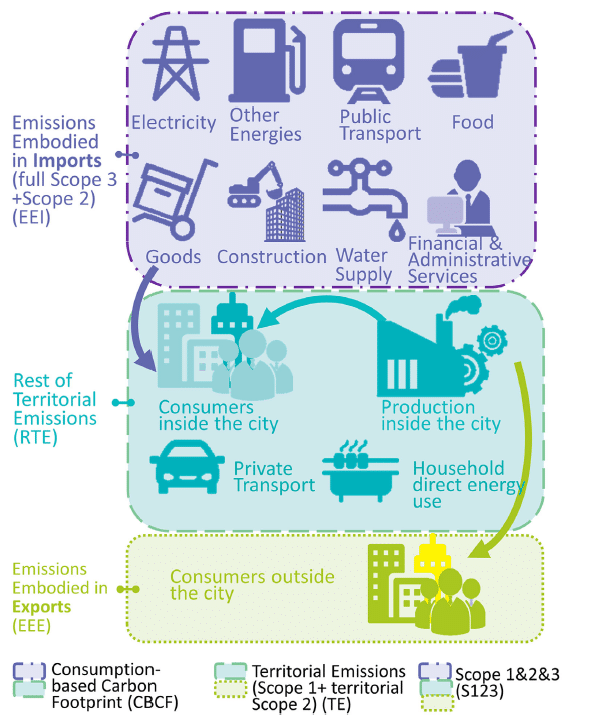
Source: Reproduced from Wiedmann et al (2019)
Scope 1 emissions are those which take place in the region itself, such as from the burning of fuels. Scope 2 are the emissions which take place outside the region but which are due to energy consumption in the region. The clear example would be electricity generation. On this perspective, it appears that Scope 1 and Scope 2 emissions in the GCR region are captured in the BEIS LA figures.
Scope 3 emissions on the other hand, would be the emissions which take place outside of GCR but which are caused by GCR’s own consumption. These would be related to the emissions footprint of GCR, and would add emissions embodied in imported goods, and subtract emissions within GCR related to products which are then exported to other areas. We note that there are currently no estimates of Scope 3 emissions for GCR.
Recent work by Wiedmann et al (2019) identified that consumption-based carbon footprints for cities are “patchy and […] based on different methods”.
Such metrics however would have significant benefits, including a holistic assessment of emissions; drawing attention to the huge range of ways to reduce global emissions from a city’s activities; and offer new perspective to engage with stakeholders on city-level climate policy.
To date, however, data issues have prevented meaningful assessment of the quantification of policies and the distribution of impacts on global emissions – at city, national and global levels respectively – in reducing emissions related to city activity.
Linking emissions to economic activity using existing data for the Glasgow City Region
Having set out the metrics of emissions which are currently produced for GCR, we now show what can be done with existing data on energy use, and economic activity in GCR. We have estimated CO2 emissions in GCR using a bottom-up approach of energy consumption which ties in with multi-sectoral economic accounts for the Glasgow City Region (produced jointly by FAI and GCC in an earlier project). In this element, all metrics relate to 2016 as that is the year of the economic accounts.
Our emissions estimates cover GCR territorial CO2 emissions from fuel use (emissions that occur within the border of the GCR), and so do not capture all elements of emissions included in the LA dataset (specifically omitted those are emissions from Domestic Transport and Land Use currently, however these could be subsequently added.).
Using economic accounts allows us to align emissions from fuel use in sectors within the GCR region, and critically, put these alongside metrics of employment.
Specifically, using the economic accounts we obtain detail on the output of the Glasgow City Region of 60 economic sectors , from which we can match with UK economic accounts, fuel use by sector data published by the ONS and the greenhouse gas conversion factor, we calculate CO2 emissions at the UK level. To these we can add emissions by households, calculated using data on domestic heating and lighting plus Glasgow’s population share of transport emissions.
We estimate CO2 emissions for each industry as the sum of emissions from fuel used in that industry by fuel type. For each fuel therefore:
Once we have identified the total CO2 emissions for that sector in the UK, we apply a scaling factor for that sector to calculate emissions to each GCR sector.
Under this methodology, our assumptions about each sectors’ use of fuels are critical.
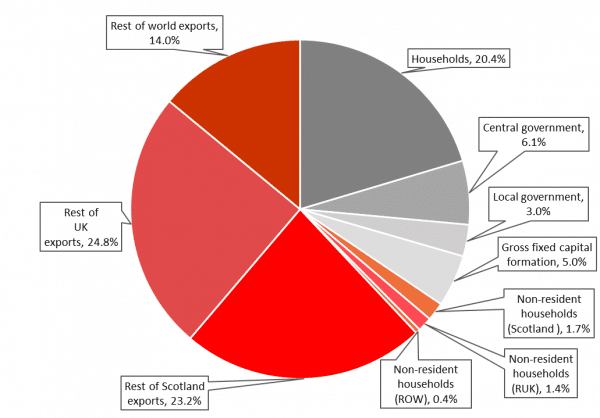
Figure 6. CO2 emissions attributed to final demand categories
Conclusions
We are in the early stages of this work, and keen to engage with and learn from those interested in city level emissions. Several things already stand out.
First, emissions for the Glasgow City Region (and all UK local authorities) are currently published on an end-user basis. This means that emissions are allocated to local authorities based on estimated fuel use and emissions factors, with transport estimated using distances travelled within local authorities and characteristics of the vehicle fleet, and emissions from electricity based on local electricity consumption and GB-wide emissions factors.
This is a useful starting point in understanding the metric against which local authorities are measuring their current level of emissions. However, a strict application of the methodology might suggest further challenges in developing policies which relate to changing behaviours around fuel use and the extent to which successful local actions would be captured in the use of country-wide metrics.
Second, we can see that there are multiple different definitions around emissions. This reflects a measurement challenge for local authorities in two dimensions: first, clarity on the emissions recorded against each authority which are within and outwith the control of local actors and local policies; and second, agreement on how decarbonisation will be delivered and the costs of such shared, when these lie across administrative boundaries.
Production-based emissions metrics offer a consistent way of squaring measures of emissions responsibility and competence to act, however below national level these might not square with the level at which tools are available to address emissions. Consumption-based emissions measures on the other hand offer a more holistic perspective on the emissions related to consumption.
Transport emissions occupy an unusual position. The existing LA method assigns responsibility for emissions based on the use of roads within an LA, irrespective of the starting point or destination of the journey. As transport emissions grow in importance for Scotland as a whole – and have comprised the largest share of emissions since 2015 – understanding more about transport choice, infrastructure and behaviours so as to reduce emissions from this activity becomes increasingly important. Underpinning the demand for transport by type is a combination of many factors including the location of housing and places of work, retail, trade and transport, including tourism. Choices about the location of these activities, will underpin decisions about the necessary infrastructure to deliver this under net zero targets by mid-century and likely reach across not only the GCR but also Scotland as a whole.
Third, by using a multi-sectoral approach we can link economic activity with emissions, including at the sectoral level. This helps us identify the drivers of GCR emissions, and the extent to which these are generated inside or outside the city region. Such a perspective is fundamental in understanding the responsibility for emissions in the city, the interconnectedness between emissions and economic activity and how changes in policy will help the city achieve its net zero ambitions. A comparison of GCR results with those of the C40 cities (C40, 2018) can help provide crucial insights to implementation of policies. We have not attempted in this work to reconcile emissions from outside GCR in the production of imports, but this would be a sensible extension for added perspective.
It might also be useful to explore key sectors related to GHG emissions similar to the recent work by Alcántara and Padilla (Alcántara and Padilla, 2020) who identified the key sectors for Spain. Additional insights on Scope 2 and Scope 3 emissions (can be useful in capturing a broader perspective on emissions at the city level (Hertwich and Wood, 2018).
In conclusion, cities have an important role to play in showing what can be done to reduce emissions and educate other, provide attractive places to live and work and are likely to remain critical for national economic activity. Glasgow has a history of being at the heart of economic revolutions and with COP later in the year is in a great position to showcase not only its ambitions, but to engage and learn from other cities in their progress towards developing policies to enable the reduction of emissions and continued economic.
Authors
Aditya Maurya

Grant Allan is a Reader in the Department of Economics. Grant's research interests in applied multisectoral economic analysis and modelling, particularly in the areas of environment, energy and tourism.

Kevin is a Chancellor's Fellow in the Department of Economic with a focus on the use of regional economic models for policy analysis. Areas of interest include; energy and climate change, poverty and tourism.