
The Scottish Child Payment (SCP) is the Scottish Government’s flagship policy for reducing child poverty. But how do we know if it’s working?
SCP was introduced in February 2021 for children under 6 in households receiving qualifying benefits like Universal Credit. It was later expanded to £20, then £25 per week, per child for children under 16.
Many people expected that SCP would significantly reduce child poverty and put Scotland on track to meet its child poverty targets by 2030/31. For example, Scottish Government modelling showed SCP reducing relative child poverty by 6 percentage points from what it would have been in 2023/24.
But a dramatic fall in child poverty rates hasn’t materialised in official statistics (Chart 1). In fact, relative child poverty measured after housing costs actually rose to 26% in 2022/23 from 23% in 2021/22, despite the huge expansion of children eligible for SCP.
Chart 1: Relative child poverty rates, Scotland, 2016/17 – 2022/23
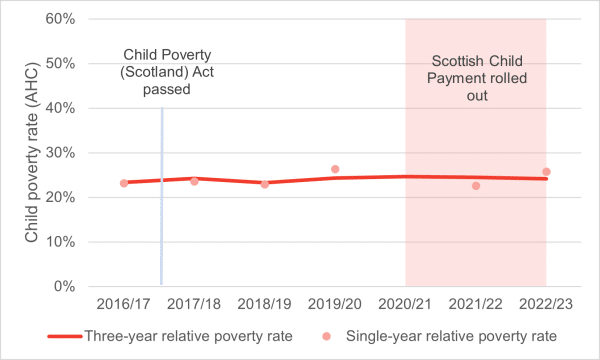
Source: Scottish Government 2024
Notes: Three-year averages are plotted in the last year covered (e.g., in 2016/17 for 2014/17). The single-year estimate for 2020/21 is excluded because the Covid-19 pandemic significantly reduced the size of the FRS sample. Three-year averages for the last three periods are actually two-year averages that exclude the 2020/21 data, and no single-year estimate is shown for 2020/21.
The proportion of eligible households that take up SCP is very high (89% in 2023/24), so it’s not that few households take advantage of the available support. However, there are several other reasons why we might not see a big change in the official poverty statistics even if SCP had an impact. For instance:
- Child poverty might have risen if SCP weren’t introduced, and its introduction and expansion just prevented a larger increase in child poverty;
- Households receiving SCP might have started off further below the poverty line than we thought, so that SCP increases their incomes but doesn’t move many above the poverty line; and/or
- Income from SCP might not be well-captured by the data used to calculate Scotland’s child poverty rates.
Our latest report considers this last reason, and evaluates whether improvements to how SCP is captured in survey data change our understanding of child poverty over the last few years.
Ultimately, we conclude that adopting the new methodology sooner would not have changed the main measure of child poverty used to measure progress towards the child poverty targets. However, the new method does a much better job of capturing the number of people receiving SCP and the amount they receive. We welcome both the change in the methodology as well as more transparency about how SCP is captured in the data.
Let’s get into the details!
How are child poverty rates calculated?
First, it’s useful to think about how official child poverty statistics are calculated.
Information on child poverty comes from the Family Resources Survey (FRS). The FRS asks around 20,000 households every year about their members’ characteristics (gender, age, etc.), different sources of income, housing, and other activities.
Information from the FRS is used to create the Households Below Average Income (HBAI) dataset, which (confusingly) covers most households in the UK, not just those on low incomes. HBAI adds up income from different sources to create different measures of household income. It also adjusts for the number of adults and children in the household so that household income is more comparable across households of different sizes; the result is called equivalised household income.
The poverty line is set at different points depending on which definition of poverty you want to use. The most commonly-reported measure is relative poverty where the poverty line is set at 60% of median UK equivalised household income. This definition of poverty is often reported both before and after housing costs (BHC and AHC).
The poverty rate is then how many households or people fall below the poverty line as a proportion of all households or people in the survey.
The FRS is collected annually from April of one year to March of the following year. It’s then published the following year, leading to a lag in child poverty statistics. So the child poverty statistics for 2023/24 are just now coming out in March 2025 and we are still looking for the impact of SCP, even though SCP was first introduced four years ago.
How does SCP fit in?
SCP is expected to have an impact on poverty rates because it is additional income, which should move some households above the poverty line.
SCP was first introduced in February 2021. At the time, children under 6 in households receiving qualifying benefits (mainly Universal Credit) received £10 per week.
The amount per week rose from £10 to £20 and finally to £25 between April and November 2022, while the eligible age range was extended to all children under 16 in November 2022 (Table 1).
Table 1: Changes in eligibility for and amounts of SCP
| Period | Eligible age range | £ per week, per child |
| February 2021 – April 2022 | 0-6 | 10 |
| April – November 2022 | 0-6 | 20 |
| November 2022 onwards | 0-15 | 25
(uprated annually from 2024/25) |
SCP represents a big change in income for eligible households – about £1300 per year for each eligible child as of November 2022. It’s also a big investment on the part of the Scottish Government, which spent £190 million on SCP payments in 2022/23.
Is SCP well-measured in the FRS?
Back to our big question – is mismeasurement of SCP in the FRS data the reason we haven’t seen a big fall in child poverty rates?
There are good reasons to ask this question. In 2021/22, SCP recipients were clearly under-counted. In 2022/23, the Department for Work and Pensions (DWP) used imputation to boost observations of households receiving SCP in the FRS.
Essentially, they chose households that should have been eligible to receive SCP until they reached a target number based on administrative data. However, this still didn’t resolve the issue, and organisations like the Joseph Rowntree Foundation raised concerns that the imputation methods were incorrectly assigning SCP to sample households. For example, several households seemed to be receiving SCP for children that were too old to be eligible at the time. It was also difficult to tell how the imputation was done, since the DWP published very little information on their methods for SCP.
Scottish Government analysts have worked with the DWP to improve these methods for the 2023/24 data. There is also additional documentation now published alongside the FRS describing how SCP is imputed. The process now identifies eligible households more carefully and gives SCP to households until the correct take-up rate is met.
To the best of our knowledge, the DWP are not planning to retroactively apply this methodology to the 2022/23 data. But we wanted to see if having better information on SCP in 2022/23 would have changed poverty rates in Scotland, so we used their new methodology on last year’s data.
We also account for some things that are not addressed in the new methodology because they do not apply in 2023/24. These things include the extension of eligibility to children 6-15 and the increase in the payment value in November 2022, as well as the bridging payments that were given to older children who get free school meals.
The updated methodology is sensible and means that the children and families that you’d expect to receive SCP in the FRS are marked as receiving the payment. If you’re interested in the details of how the new methodology works, check out our full report here.
What does a change in methodology mean for published poverty statistics?
Would the methodology have changed our perspective on child poverty if it were applied to last year’s data?
Ultimately, not by much. Child poverty falls by 1-3 percentage points by some measures, but child poverty under the main definition of poverty (60% of median income after housing costs) remains 26%. This is the measure used to judge progress towards the interim child poverty targets in 2023/24, so we would still have had significant concerns about whether or not the interim targets could be reached.
Why does poverty fall by some measures and not by others?
When we applied the new methodology, we also had to take away the old method of replacing missing information on SCP. Most households in the sample that were affected by the change in methodology saw an increase in their measured income, but some had reduced income. Changes in poverty rates depend on how close different households are to the relevant poverty line. For the 60% after housing costs (AHC) measure, the number of households falling above or below the line with the change in methodology about evened out, so the poverty rate didn’t change.
What happens next?
The change in methodology is undoubtedly better than what was previously used, and users of the statistics should now have more confidence in how well SCP is captured by the survey data.
However, it’s disappointing to see that even doing a better job of accounting for SCP wouldn’t have meant a lower child poverty rate in 2022/23. We still don’t see a large impact from SCP – although this could be for another reason. For instance, child poverty might have risen from other causes in the absence of SCP. There are now signs of a fall in child poverty for 2023/24, which is promising.
Given the relative stagnation of child poverty rates over the last few years, even when SCP is well-measured, it’s perhaps not surprising that child poverty fell in 2023/24, but not by enough to meet the interim targets. It’s clear that significant measures will be needed to have a chance at meeting the final targets in 2030/31.
The new child poverty statistics for 2023/24 just came out this morning, so watch our for our full analysis later today.
Over the next year, we’re looking forward to the next (and final) child poverty delivery plan next spring, as well as the Holyrood election party manifestos. We’ll be publishing more analysis as both of those events approach, but in the meantime, check out our analysis of policy packages that could help meet the 2030/31 child poverty targets here.
You can find a more detailed description of the new SCP methodology and how we applied it to the 2022/23 FRS data in our report here.
abrdn Financial Fairness Trust has supported this project as part of its mission to contribute towards strategic change which improves financial well-being in the UK. The Trust funds research, policy work and campaigning activities to tackle financial problems and improve living standards for people on low-to-middle incomes in the UK. It is an independent charitable foundation registered in Scotland (SC040877).
Authors

Hannah is a Fellow at the Fraser of Allander Institute. She specialises in applied social policy analysis with a focus on social security, poverty and inequality, labour supply, and immigration.

Chirsty is a Knowledge Exchange Associate at the Fraser of Allander Institute where she primarily works on projects related to employment and inequality.

Emma Congreve is Principal Knowledge Exchange Fellow and Deputy Director at the Fraser of Allander Institute. Emma's work at the Institute is focussed on policy analysis, covering a wide range of areas of social and economic policy. Emma is an experienced economist and has previously held roles as a senior economist at the Joseph Rowntree Foundation and as an economic adviser within the Scottish Government.