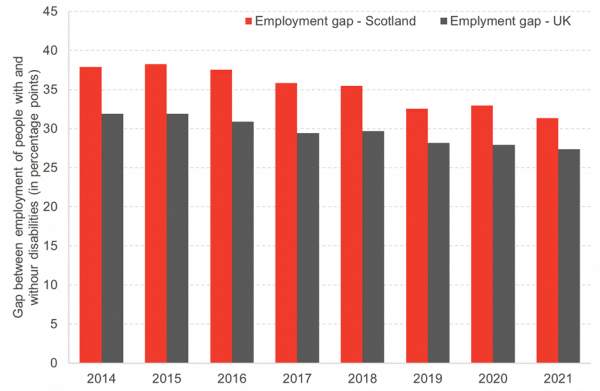
Disabled adults are significantly less likely to be in work compared to adults without disabilities. In Scotland, 81% of working aged adults without disabilities had jobs in 2021, compared to just under 50% of adults with disabilities. This discrepancy of 31 percentage points – called the “disability employment gap” – is larger in Scotland compared to the rest of the UK (Chart 1).
Scotland has a goal of reducing the disability employment gap by half between 2016 and 2038. The 2021 numbers, encouragingly, show an improvement of 6 percentage points. A higher proportion of disabled people moved into work in Scotland between 2014 and 2021 compared to the UK as a whole, as well.
Chart 1: Gap in employment between people with and without disabilities in Scotland and in the UK, 2014-21
In 2023, the DWP published a report on the employment of disabled people in the UK. This report looked at the reason why employment among people with disabilities has increased, while employment for the rest of the population has stayed roughly the same.
The DWP report highlighted four reasons behind the growth in the number of disabled people in employment:
- Disability prevalence has increased in the UK, and the most common types of disabilities have changed.
- The non-disabled employment rate has increased, implying that more jobs are available to both groups.
- The disability employment gap has been narrowing overall.
- There are more individuals in the working-age population.
The level of detail provided in the DWP report for the UK is difficult to replicate for Scotland with publicly available data: smaller sample sizes north of the border mean that more restrictions are placed on the data available to ensure that appropriate care has been taken with interpreting the robustness of results.
The Fraser of Allander Institute, in collaboration with the Scottish Parliament Information Centre (SPICe) are undertaking work to understand whether the same factors are driving changes in Scotland, and if not, what is different here and why.
This work is ongoing and future articles will get into more of the detail. This article sets the scene about the scale of the issue in Scotland vs the UK based on what know from data currently available.
What’s the state of disability employment in Scotland?
Scotland has a higher proportion of working-aged disabled people compared to the UK. It also has a lower rate of employment among disabled people, and a larger gap in employment between people with and without disabilities. Employment rates are noticeably different for different types of disabilities in Scotland compared to the rest of the UK, and disabled peoples are less likely to have educational qualifications in Scotland.
How is disability defined?
The current definition used in UK (and Scottish) surveys comes from the Government Statistical Service and the 2010 Equality Act. This change affected data collection from mid-2013 onwards, meaning that it’s not possible to compare current data to data before 2013. Our analysis specifically looks at the data since 2014 as a result.
This definition covers people who report “current physical or mental health conditions of illnesses lasting or expected to last 12 months or more; and that these conditions or illnesses reduce their ability to carry out day-to-day activities.” Previously, the definition was based on the Disability Discrimination Act (2005) (DDA), which applied to “all people with a long term health problem or disability that limits their day-to-day activities.” The slight difference in these terms means that some people may qualify as DDA disabled but not as Equality Act disabled.
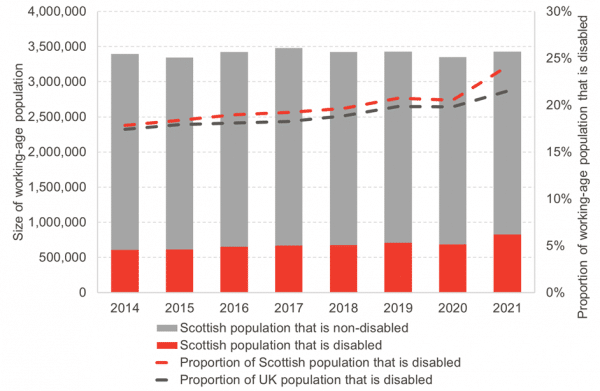
Scotland has consistently had a higher proportion of working-aged disabled people.
In 2014, around 18% of the Scottish working-age population were classified as Equality Act disabled.
Since 2014, the number of disabled working-age adults has grown by around 222,000 people, making up over 24% of the working-age population as of 2021. By comparison, the total size of the working-age population only grew by around 31,000 people over the same time period. had a higher proportion of disabled adults in 2014 than the UK average, and this gap has widened over time. The 2021 data shows a further significant divergence, but this may be due to particular issues related to the pandemic and may not persist (Chart 2).
Chart 2: The size of the Scottish population with and without disabilities, and the proportion of the population with disabilities from 2014-21.
Scotland has a higher disability gap and a lower rate of employment among disabled people.
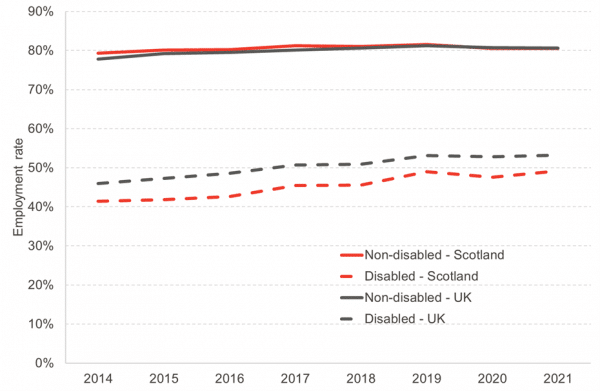
Employment rates for working-aged people without disabilities in Scotland is roughly the same as in the rest of the UK. Employment rates for disabled people is much lower, however.
Since 2014, disabled people have moved into work faster in Scotland compared to the rest of the UK. The employment gap fell by around 6.5 percentage points between 2014 and 2021 in Scotland, compared to a fall of around 4.5 percentage points for the entire UK (Chart 3).
Chart 3: Proportion of adults between 16-64 that are in work by disability status, Scotland and the UK, 2014-21
Scotland has different employment rates for people with different types of disabilities.
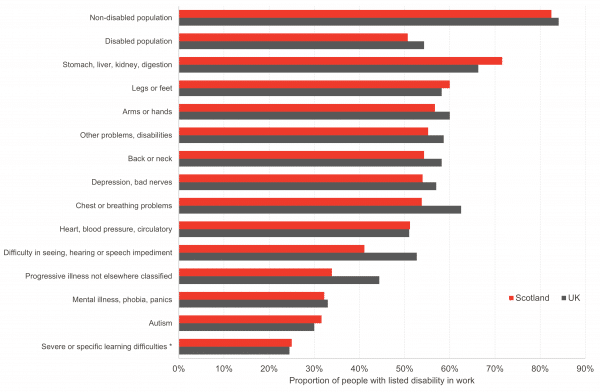
Unsurprisingly, Scotland has lower employment rates than the UK as a whole for the vast majority of types of disability.
The largest differences in employment rates are for people with diabetes, chest or breathing problems, and difficulty with seeing, hearing, or speech. Scotland fares better in the employment of people with stomach, liver, kidney and digestion problems, for instance, and slightly better for people with autism.[1]
Chart 4: Proportion of the working-age population with disabilities by working status and type of disability, 2022
Disabled people have lower qualification levels in Scotland.
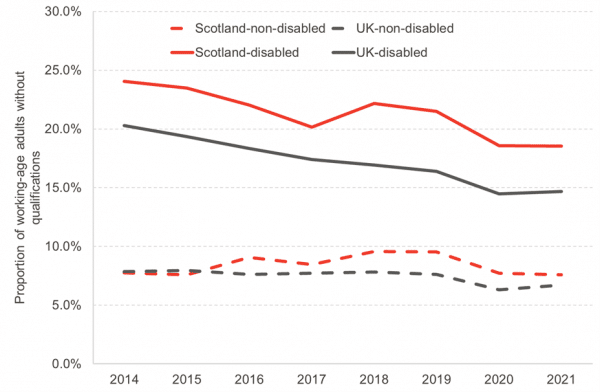
Disabled people are more likely to have no qualifications than those without disabilities, both in Scotland and the UK. Scottish adults are also more likely to have no qualifications compared to the rest of the UK, although the gap in qualifications for disabled people is larger for Scotland than for the rest of the country (Chart 4).
The proportion of people with no qualifications has been falling in recent years. This may be due to older people, on average, being less likely to have formal qualifications, and as they move to retirement age, the number of working age people without qualifications goes down.
For disabled people, it may also be true that the increase in the number of disabled people have changed the make-up of the disabled population, especially for people who are becoming disabled later in life (for example, due to mental health issues that present post-education).
Chart 5: Proportion of working-age adults with no qualifications by disability status, Scotland & rUK, 2014-21
Where are there gaps in our knowledge?
As discussed at the start, publicly available data on disability types is severely limited. For example, survey data in Scotland has detailed disaggregation on different types of disability, but only publicly provides information on whether or not someone qualifies as disabled under the 2010 Equality Act definition. The Scottish Government has been making strides to improve this data, however – a 2022 publication analyses disability employment by type of disability, but only examines one year.
One particular issue that we have found is for people who have a learning disability where the data is extremely poor. We will be publishing a new article later this week that sets out some of the particular issues for people with a learning disability.
Our next phase of research will look into more of the detail around employment levels for people in Scotland living with different disabilities based on access to non-public secure data held by the ONS. There may still be limits on the data we are able to use (for example, where robustness thresholds set by the ONS are not met), but we hope we will be able to add to the evidence base here in Scotland and provide better insights for policy makers and stakeholders on where support needs to be focussed.
Footnotes
[1] Statistics on individuals with severe and specific learning difficulties have a small sample size and analysis relative to the UK data cannot reliably be done.
Authors
Allison is a Fellow at the Fraser of Allander Institute. She specialises in health, socioeconomic inequality and labour market dynamics.
Chirsty is a Knowledge Exchange Associate at the Fraser of Allander Institute where she primarily works on projects related to employment and inequality.


