-768x432.jpg)
It’s that time of year again! Child poverty statistics for 2024-25 came out this week, two weeks after we saw the Scottish Government’s final child poverty delivery plan.
The good news is that two of the four main measures of child poverty, relative and absolute poverty after housing costs, have fallen slightly since the previous year. On the other hand, persistent poverty rose slightly, and we can’t compare this year’s material deprivation statistic to past years due to methodological changes.
But all of these figures are based on revised statistics. The revisions were needed to deal with changes in the Family Resources Survey (FRS), which forms the basis for the child poverty statistics – and further revisions are coming.
More on the revisions in a minute – for now, we’ll focus on the statistics themselves.
Table 1: Headline child poverty rates after housing costs, Scotland
| Measure | 2021-24 | 2022-25 |
| Relative poverty | 22% | 21% |
| Absolute poverty | 24% | 23% |
| Material deprivation + low income | — | 11% |
| 2019-2023 | 2020-2024 | |
| Persistent poverty | 16% | 17% |
Source: Scottish Government
The new statistics show that, in the latest period, relative child poverty was 21% and absolute poverty was 23%. Both are down by 1 percentage point in 2022-25 compared to 2021-24.
Combined low income and child material deprivation was measured at 11%, although methodological changes mean we can’t compare this to earlier years. Persistent child poverty rose slightly from 16% in 2019-2023 to 17% in 2020-2024, after a 7 percentage point revision to the 2019-2023 figure.
Figure 1: Relative child poverty after housing costs, Scotland
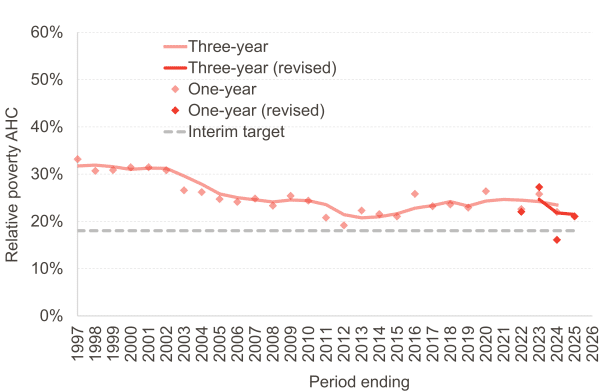
Source: Scottish Government
Figure 2: Absolute child poverty after housing costs, Scotland
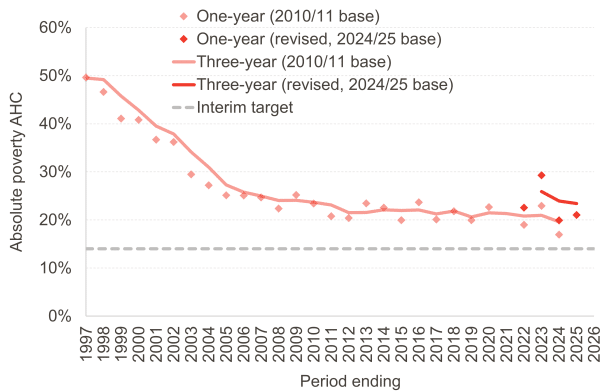
Source: Scottish Government
Last year, we said that Scotland had missed the interim child poverty targets in 2023/24, and was not really on track to meet the 2030/31 targets without some fairly significant policies. Do the new statistics change this picture?
Roadworks ahead
This brings us to a key feature of the new statistics: they are based on better information about which households in the FRS receive reserved benefits, and how much. The new information comes from linking survey respondents to their records in DWP’s benefit data, rather than relying on them to report their benefit income.
This is a big step forward, but comes with some short-term drawbacks in understanding the data and the statistics that are derived from them.
First is that the linkage has also been carried out in past years, but only to 2021/22 (and later this year, to 2018/19). That creates a break in the data series, limiting our understanding of how poverty has changed over time. Essentially, we can’t compare statistics before and after the break like-for-like.
The break in the data is particularly problematic for absolute poverty. The absolute poverty line was previously based on incomes in 2010/11, but those incomes will no longer comparable to incomes from 2018/19 onwards. It isn’t clear yet how the absolute child poverty target for 2030/31 – which is based on the 2010/11 measure – will be evaluated going forward.
A second issue is that only benefits administered by the UK Government – and not those administered by the Scottish Government – have been linked. This artificially lowers incomes in Scotland relative to the rest of the UK, which could affect poverty measures – particularly relative poverty, which is set against a UK-based poverty line.
This second issue will hopefully be resolved next year, when devolved benefits are due to be linked. That will solve the issue of comparability across the UK, but may change our understanding of child poverty yet again next year.
We are also expecting a change to the household weights that are used to scale up the survey data to represent the population. And going forward, there will be even more changes to the data, including for earnings.
Because these changes are being introduced gradually, the Office for Statistical Regulation has agreed to reclassify this year’s poverty statistics as ‘official statistics in development’, acknowledging that the data is in a transitional stage.
All of these revisions affect three out of four of the child poverty targets, namely relative poverty, absolute poverty, and combined low income and material deprivation. Persistent poverty is measured using a different data source, namely Understanding Society.
Confusingly, this measure has also been significantly revised, but for a different reason, namely a revision to the household weights. The Scottish Government also expect further revisions going forward. However, as this measure has always been badged simply as ‘official statistics’ rather than ‘accredited official statistics’ – and tends to be revised to some extent year-to-year anyway – it is unaffected by the reclassification.
In the balance
So, back to the targets. Persistent child poverty and combined low income and child material deprivation remained above the interim targets in 2023/24, even after this first round of revisions. However, for the time being, relative child poverty has been revised down from 22% to 16% – below the interim target of 18%.
As indicated in Figure 1, the relative child poverty rate in 2023/24 was something of an outlier. Although there does appear to be a downward trend, the rate was notably higher in both the previous year and the subsequent year. This is a prime example of why statisticians prefer three-year averages, which smooth over short-term fluctuations that may or may not be meaningful.
Whether or not the interim target for absolute child poverty was met is even less clear. Using a 2010/11-based poverty line, the absolute child poverty rate in 2023/24 was revised downwards from 17% down to 10%, which is below the interim target of 14%.
But as noted above, there is an inconsistency in comparing incomes from 2010/11 to those in later years due to the break in the data. The 2010/11 base is enshrined in legislation, so it would appear that this interim target may have been met on the latest estimates – but only on a technicality.
In any case, all of this is still a partial picture, with further revisions coming in subsequent years. Whether the interim targets were in fact met remains to be seen.
Flying blind
But does any of this change our prospects of meeting the final child poverty targets in 2030/31? Yes and no.
Low-income households and households with children are more likely to be receiving benefits, so correcting for the underreporting of benefits should reduce measured child poverty rates. For the most part, this is evident in the latest revisions, even before Scottish benefits have been linked.
On the other hand, upcoming improvements to the weighting regime could mean that a higher proportion of the population is represented as having low incomes to begin with, which would have the opposite effect. The impacts of other forthcoming changes are also ambiguous.
Of course, changes to the data are not real-world changes. But where we sit in relation to the targets does (or at least should) drive policy decisions. This picture will be repeatedly shifting over the next few years – right as we approach the targets. So while the improvements are welcome, the timing is far from ideal.
Even more concerning is that there is no clear timeline for when the improvements will be fully completed. Given how long we have been waiting already – administrative data linkage was recommended by a strategic review of the FRS as far back as 2004, over twenty years ago – we can’t help but worry that we will still be in limbo come 2030.
There are also some underlying issues with the data that will not be resolved by the planned improvements. Ultimately, it’s impossible to improve data that doesn’t exist in the first place.
The proportion of surveyed households who provided a response remained unchanged between 2023/24 and 2024/25, halting a long-running decline in the size of the sample that is achieved in the data. But the response rate continues to be lower in Scotland than other UK nations and lower than in pre-pandemic years.
As a result, the levels of uncertainty surrounding the statistics remain high: although the central estimate is that 21% of children were living in relative poverty in 2022-25, we cannot rule out values as low as 16% or as higher as 26%, even if we assume that the data is accurate. There is a mismatch between statutory targets based on exact figures and data that comes with this degree of uncertainty.
But at the end of the day, questions around the data should not distract us from the big picture. Scottish Government modelling using the non-updated version of the FRS projected a relative child poverty rate of 18% in 2030/31, even accounting for the policies announced in the latest Tackling Child Poverty Delivery Plan. It’s unlikely that data revisions will bring that figure down to 10%.
Come May, the new government will still have a lot of work to do if it wants to meet the targets.
Authors

Spencer is a Senior Knowledge Exchange Fellow at the Fraser of Allander Institute.

Hannah is a Fellow at the Fraser of Allander Institute. She specialises in applied social policy analysis with a focus on social security, poverty and inequality, labour supply, and immigration.