
Overview
At the end of last year, we published our first ‘back to basics’ article on Scotland’s business base. This article is the second in our series and we will be discussing how investment in R&D has evolved over the past few years, the challenges and opportunities for R&D in Scotland, and the future of R&D.
We cover Scotland’s R&D performance internationally and nationally, R&D tax relief, the limitations of R&D data, and R&D in Scotland’s growth sectors.
This article is outlined as follows –
- The data: research & development in Scotland
- Gross Expenditure on R&D (GERD)
- Regional comparisons
- Composition of GERD
- Challenges & opportunities for R&D in Scotland
- Investment and tax relief
- Limitations of the data
- The future of R&D in Scotland
- Scotland’s growth sectors
The data: research & development in Scotland
Since 2016, investment in research and development has been a national indicator under the Scottish Government’s national performance framework, measured by Gross Expenditure on R&D.
Gross Expenditure on R&D (GERD) is made up of several types of R&D, including:
- Business Enterprise R&D (BERD);
- Higher Education R&D (HERD);
- Government R&D (GovERD); and,
- Private Non-Profit R&D (PNP).
Gross Expenditure on R&D (GERD)
Scotland’s GERD in 2018 was £2.7bn, 1.6% of GDP, and a 0.03 percentage point (p.p.) increase on 2017. In the past few years, R&D’s share of Scottish GDP has significantly risen, narrowing the gap between itself and the UK.
The UK’s gross R&D expenditure in 2018 was over £37bn. The UK R&D spend as a share of UK GDP was just over 1.7% in 2018, a 0.04p.p. increase on the previous year. Chart 1.
Chart 1: Growth in GERD (as % of GDP), Scotland and UK, 2007 – 2018
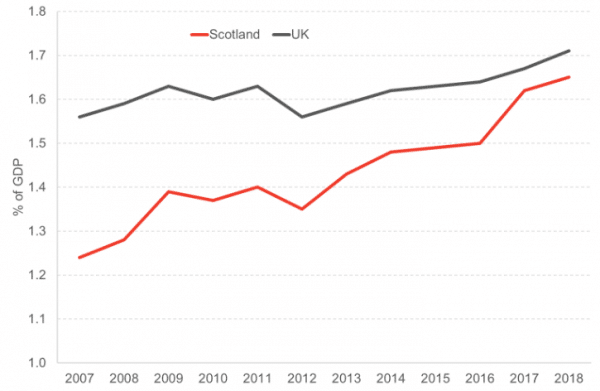
Source: UK Government, ONS
Regional Comparisons
Scotland and the UK perform relatively middle of the pack when compared to other OECD countries. GERD in Scotland was below the OECD average (2.4%) and the EU average (2.05%). This ranked Scotland in the lower half of OECD countries for gross spend on R&D. Chart 2.
Chart 2: GERD as % of GDP, OECD Comparison, 2018
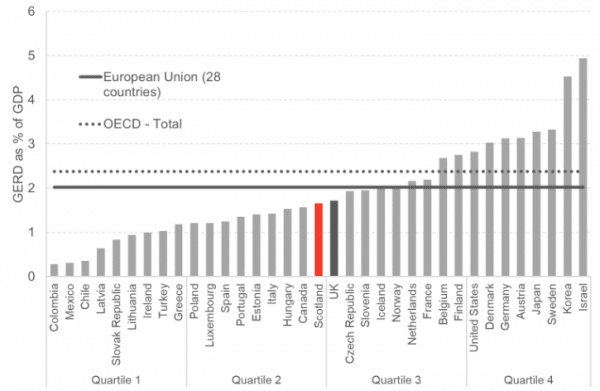
Source: Scottish Government
The average R&D spend by UK regions stood at just over £3bn in 2018 however, London and surrounding areas significantly skew this average.
In terms of GERD per head, Scotland had the 5th highest spend per capita of the 12 UK regions. Chart 3.
Chart 3: GERD per head across UK Regions, 2018
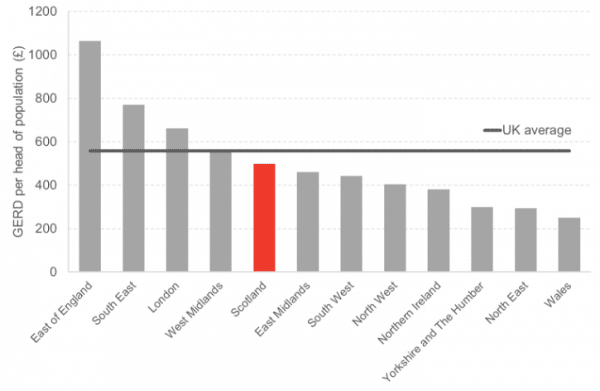
Source: ONS, UK Government
Composition of GERD
In the past decade, the composition of GERD has been taken over by business R&D. In 2018, half of total R&D spend in Scotland came from businesses. Chart 4.
Chart 4: Components of GERD (real terms), Scotland, 2011 – 2018
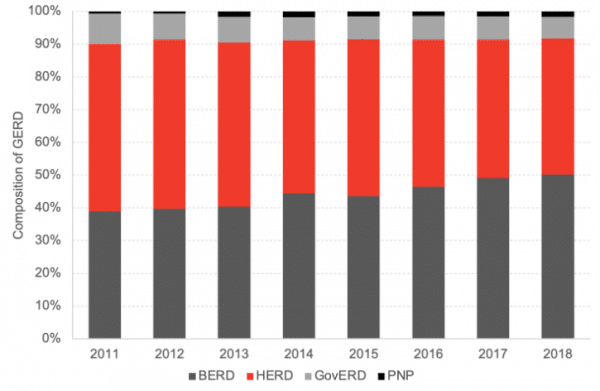
Source: Scottish Government
HERD used to make up a very similar share of total R&D however, higher education R&D spend experienced growth of just under 10% in real terms since 2011, compared to an increase of over 70% of BERD in the same period. GovERD’s share of total R&D also decreased during this period – due to a reduction of R&D spending of 5% since 2011. Chart 5.
Privat non-profit (PNP) R&D experienced the greatest increase over the period, rising by almost four-fold. Despite this rise, private non-profit R&D makes up just 2% of total R&D spend.
Chart 5: Real growth in GERD and it’s components, Scotland, 2011-2018
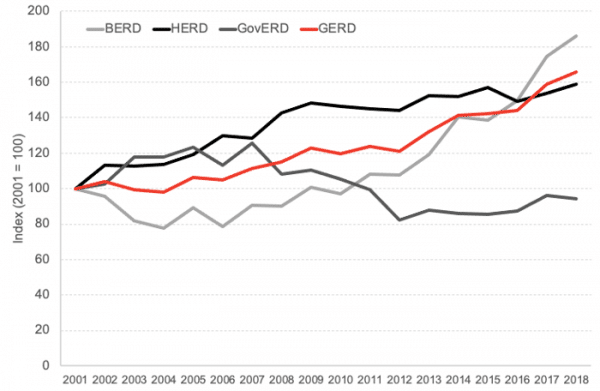
Source: Scottish Government
So, what has driven the rise in BERD activity?
At the start of the century, manufacturing dominated business R&D however, as we know very well manufacturing activity has been steadily declining over the past few decades. On the other hand, services, i.e. information and communication services, have experienced significant growth since the start of the noughties – this sector now makes up over ¾ of the Scottish economy.
Chart 6 highlights BERD investment by sector, since the start of the century, for Manufacturing, Services and ‘Other’ which consists of –
- Agriculture, forestry, and fishing;
- Extractive industries;
- Electricity, gas & water supply, waste management; and,
- Construction
Chart 6: Investment in BERD by sector, 2001 – 2019
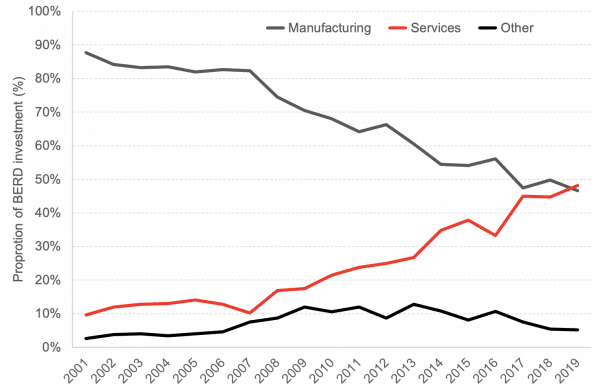
Source: Scottish Government
Since the Great Recession, services R&D has seen significant growth. The sharp rise in services has been driven by R&D spend in technical testing and public administration.
Within the manufacturing sector, chemicals manufacturing, and electrical machinery manufacturing have consistently driven R&D.
The share of BERD investment by manufacturing and services has narrowed significantly in the past two decades with services now making up the greatest share of business R&D.
Challenges and opportunities in R&D investment
Investment & tax relief
To increase R&D intensity, policymakers often seek to ensure that there are efficient R&D incentives in place to support private investment. In this regard, R&D is subject to classic ‘market failures’.
Incentives can range from R&D investment by the government or R&D tax relief.
The Scottish Government can support gross R&D in Scotland through increased investment in GovERD and HERD. One way in which the Scottish Government can boost business R&D is through supporting grants through enterprise agencies, such as Scottish Enterprise.
However, the Scottish Government is not the only route through which firms can attain funding for R&D activities. There exists a number of UK government bodies such as the Department for Business, Energy and Industrial Strategy (BEIS) and the UKRI which offer Scottish firms R&D funding.
R&D tax relief tends to be offered through taxes that are reserved to the UK Government.
UK R&D relief is available for both Small & Medium Enterprises (SMEs) and large firms.
SME R&D relief is available for companies with less than 500 staff and a turnover under 100m euros (or a balance sheet total under 86m euros). SME R&D relief allows firms to:
- Deduct 130% of their qualifying costs from their yearly profit, on top of the 100% normal deduction, amounting to a total of a 230% reduction; and,
- Claim a tax credit, of up to 14.5% of the surrenderable loss, if the company is loss-making.
Large companies in the UK can claim Research & Development Expenditure Credit (RDEC) for R&D ventures. RDEC is a tax credit worth 13% of qualifying R&D expenditure (as of 1st April 2020).
SME, RDEC, and overall R&D claims in the UK fell by just under 5% between 2017/18-2018/19. Claims across SMEs and larger firms fell in Scotland too over the year however, the effect was less pronounced than across the UK overall.
Chart 7 highlights the number of tax relief claims and the total cost of claims for the latest year. Unsurprisingly, there is a high concentration of R&D activity in London and surrounding areas.
It is worth noting that regional R&D relief data is based on the registered office location of each business and such registered office may not be where the R&D activity is taking place.
Scotland accounted for just 5% of tax relief costs in 2018/19. This is similar to Scotland’s share of total R&D relief claims and SME claims. However, in terms of RDEC claims, Scotland accounts for around 7% of the UK total.
Chart 7: Number of claims and cost of claims by UK region, 2018/19
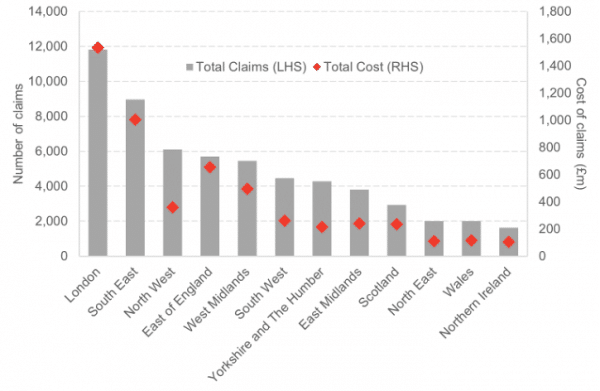
Source: HMRC
There is scope to increase/decrease tax relief for R&D performers in Scotland however, this is up to the UK Government. Further tax reliefs may be perceived to have the biggest impact in the regions where claims are already high (London, South East, etc.) because these areas are seen as the most conducive to R&D investment.
But, as discussed, Scotland’s GERD has experienced significant growth in recent years, driven mostly by BERD which now accounts for the majority of R&D spend in Scotland.
So, while the data indicates that UK R&D is dominated by London and surrounding areas, there are two important reasons to not disregard investment in Scotland:
- BERD performance in Scotland highlights that there are significant investment opportunities in Scotland; and,
- There are significant caveats with R&D data so decisions should not be made based solely on these statistics.
Limitations of the data
GERD is commonly used to make international comparisons and includes all R&D activity, including R&D funded from abroad however, it does not include R&D activity abroad funded by the UK.
The sources of the four components of the GERD data are:
- BERD – ONS’ annual business R&D survey (survey of 5,500 UK businesses, of which 4,000 are in Great Britain and 1,500 in Northern Ireland).
- HERD – estimates provided by Higher Education Funding Councils for England, Scotland, and Wales, and the Department for Education for Northern Ireland (covers all 164 UK higher education institutions).
- GoveRD – annual survey of in-house R&D from government departments, including 140 agencies and research councils (some local authority and central government R&D are not available from the survey).
- PNP – biennial ONS census survey (started 2011) of around 200 non-profit organisations.
An important thing to understand is how the Scottish data is collected and estimated. The ONS’ annual BERD survey collects data on businesses in Scotland known to perform R&D which are then used for the Scottish Government’s GERD statistics.
For Great Britain, businesses sampled include businesses that have previously reported R&D spend above a threshold (£5.7m in 2018 survey), known as ‘large R&D performers’; and, the remaining and potential R&D performers. Large R&D performers are asked which business site performed R&D and how much was spent at that site. The latter group of R&D performers are included in the sample using employment and industry product data.
In the latest survey, large R&D performers accounted for 4/5 of expenditure. For small R&D performers, regional data is estimated using sample returns. Therefore, the bulk of R&D expenditure data comes from business reports however, around a fifth is estimated using sample returns.
There is some under-coverage deriving from source data as BERD relies on the Annual Business Survey (ABS) which is a survey of businesses on the Inter-Departmental Business Register (IDBR). The IDBR doesn’t cover some industries, such as agriculture, finance, and public administration. Given this, sample sizes can be small for smaller businesses (those employing under 50 employees) in these sectors.
Another issue with the BERD data is that while Manufacturing R&D is broken down into 22 industries and services into 8 industries, the ‘other’ sector is just broken down by the four sectors mentioned above. It would be useful to have a more detailed breakdown of this ‘other’ business R&D spend. However, given that often data for this ‘other’ sector is disclosive, a larger sample of businesses in these industries would need to be covered to achieve this more detailed sectoral breakdown of spend.
HERD data for Scotland is provided by the Scottish Funding Council (SFC). The Higher Education Statistics Agency (HESA) provides additional data on external research funding (overseas), non-profit organisations, and businesses. All universities are required to provide data to HESA and regional R&D expenditure is based on the region of the higher education institute.
One significant caveat here is that we do not know how much of HERD is transformational research that links academia to industry. That is, the data does not tell us how much investment is going towards improving production efficiency and productivity across Scotland.
Government R&D is collected by the GovERD survey of 140 government departments and 7 research councils. This expenditure covers departments such as the Department for Business, Energy and Industrial Strategy (BEIS) and agencies such as the Food Standards Agency. Until the 2015 survey, estimates used each department’s full-time equivalent (FTE) R&D employees, by region, to estimate regional expenditure however, departments now provide breakdowns of R&D spend by region.
The PNP survey asks the same questions as in the BERD questionnaire. PNP sector includes charities and trusts, particularly those in medical research. The PNP survey for Scotland is available from 2011 and was last carried out in 2018, collecting data for 2017. Survey results for 2012, 2014, 2016, and 2018 are estimated. Each organisation provides postcodes for sites performing R&D and allocate a share of total spend to each site. Non-responder’s expenditure is regionally allocated using country region codes from the business register.
Overall, there are some estimation methods employed to regionalise some R&D spend to Scotland however, a significant amount of Scottish GERD spend comes from direct accounts of Scottish businesses, universities, government departments, and non-profit organisations.
But, for reasons discussed, caution should be used when using BERD and HERD data, both of which make up the majority of GERD in Scotland.
Scotland’s growth sector database is a useful tool to better understand research and development in Scottish sectors.
The future of R&D in Scotland
Scotland’s growth sectors
In Scotland, there a number of sectors in which the government believe Scotland possesses comparative advantage branded ‘Growth Sectors’, these include:
- Food and drink (including agriculture and fisheries);
- Creative Industries (including digital);
- Sustainable tourism;
- Energy (including renewables);
- Financial and business services; and,
- Life sciences
Given that these sectors have been identified as having high growth potential, it is unsurprising that around 65% of BERD is conducted within Scottish growth sectors.
Life sciences, financial services, and creative industries spent around £775m on R&D in 2018. Chart 8.
The Scottish Government estimates R&D expenditure in financial services at £250m.
Chart 8: Expenditure in R&D by Scottish Growth Sector, 2018
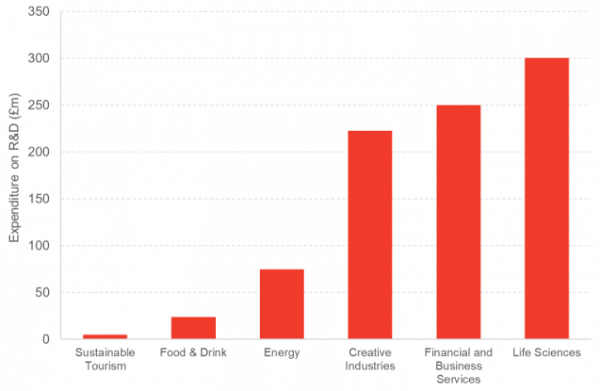
Source: Scottish Government
In Scotland, there are over 700 life science related organisations, making the sector a driving force in the Scottish economy. The collaboration between academia, industry and the government in supporting research and development in the pharmaceuticals and life sciences sector during the ongoing pandemic has been unprecedented and will hopefully be continued post-COVID to support future R&D growth.
Additionally, given its unique makeup, Scotland is equipped with the natural resources conducive to leading renewable energy research, helping to drive Scotland and the UK’s net zero emission targets.
The Scottish Government’s Programme for Government outlined that the economic recovery from COVID-19 must be a ‘green recovery’, a recovery that tackles the climate crisis but fosters employment opportunities, helping the economy recover from the current crisis.
To support this, the Government has committed to spending £100m over the next five years to a Green Jobs Fund to finance job creation in the green economy. In addition to this the PfG outlines other green recovery plans such as R&D plans for zero emission mobility. Scotland’s abundance of renewable and clean energy puts it in a strong position to face the ongoing climate challenge and to have a green recovery from the current economic crisis. But, this will require significant R&D investment.
Summary
Scotland’s spend on research and development has increased in the past decade but its total spend on R&D lags behind the UK and other leading OECD countries. However, within the UK, London, and surrounding areas significantly skew the UK average and Scotland actually performs fairly well out of the 12 regions.
There are opportunities for Scotland to grow its R&D activity through additional funding and tax relief but to address questions surrounding how to incentivise R&D, it is important to acknowledge the limitations of the data available.
There are some limitations of the BERD data such as the under-coverage of small businesses and businesses in some industries such as finance. However, by looking at Scotland’s growth sector database we were able to analyse R&D activity in Scotland’s financial services sector. This sector, along with Scotland’s other growth sectors account for a large share of Scotland’s R&D and there are a lot of opportunities for growing Scotland’s research and development within these industries.
Continued growth in these sectors will require significant investment and policies that incentivise R&D activity must be in place. However, as this article has highlighted, decisions must not be based solely on data that has as many caveats as the GERD data.
Authors

Ben is an Economist Fellow at the Fraser of Allander Institute working across a number of projects areas. He has a Masters in Economics from the University of Edinburgh, and a degree in Economics from the University of Strathclyde.
His expertise lies in various economic modelling approaches, social care, and evaluating social impact for organisations across the private, public and third sector, particularly where evaluation requires intuitive approaches.

Adam McGeoch
Adam is an Economist Fellow at the FAI who works closely with FAI partners and specialises in business analysis. Adam's research typically involves an assessment of business strategies and policies on economic, societal and environmental impacts. Adam also leads the FAI's quarterly Scottish Business Monitor.
Find out more about Adam.