
Economic theory tells us that trade can help boost employment outcomes in the long run. However, the benefits of trade are not necessarily experienced equally, or at all. Evidence suggests that some sectors do better than others and that the impact on labour can differ by gender, skill groups, age groups and part of the UK.
Some countries, such as the United States and Canada have sought to improve their understanding of the distributional impact of trade by estimating these various impacts. However, a gap in existing statistics exists for the United Kingdom, particularly when looking at distributional impacts.
Today we have published a new report on behalf of the UK’s Department for International Trade – ‘Evaluating the impact of exports on UK jobs and incomes‘.
The report examines how jobs in the UK are supported by exporting activities. In particular, it investigates how these supported jobs are held within different parts of society.
Headline results
- We estimate that UK export production supported around 6.5 million full-time equivalent (FTE) jobs, or 23% of total UK FTE jobs, in 2016.
- Around 58% (3.8 million) of these jobs were in exporting industries (jobs supported ‘directly’ by exports) and 42% (2.7 million) were in the UK supply chain of exporting industries (jobs supported ‘indirectly’ by exports).
- The number of jobs directly and indirectly supported by exports is estimated to have increased between 2014 and 2016 by around 387,000.
- The sector whose exports support the largest number of jobs is Manufacturing.
- The sectors most dependent on exports (in terms of absolute number of jobs) are the ‘Professional, scientific and technical services’ and ‘Admin and support services’ sectors.
- The country which supports the largest number of jobs through exports is the United States (US); UK exports to the US supported directly and indirectly around 1.3 million UK jobs (or 4% of all UK FTE jobs). Over the same period, exports to the EU and the RoW supported 2.8 million and 3.7 million UK FTE jobs, respectively.
- Over a quarter of FTE jobs directly and indirectly supported by UK exports are estimated to be in London.
- Given the sectoral make up of exporting sectors, we estimate that the median wages are on average higher for both direct and indirect jobs: showing the importance of exporting for supporting high wage paying sectors.
- Further estimates are derived for personal characteristics to provide insights into the challenges and opportunities that a change in exporting may have for particular parts of the population. For example, our estimates suggest that men benefit disproportionately from UK exporting activity: of all the UK FTE jobs that are directly and indirectly supported by exports, 36% are held by women and 64% by men. Similar estimates are derived for people with different qualifications, occupations and ages.
Jobs supported by destination country
The single destination country which supported the largest number of UK jobs in 2016 was the United States, which supported almost a fifth of the direct and indirect jobs that are reliant on exports. For comparison, over the same period exports to the Non-EU as a whole supported 3.7 million UK FTE jobs (or 13.0% of total UK FTE jobs) and exports to the EU supported 2.8 million FTE jobs (9.7% of total UK FTE jobs).
The table below shows the numbers of FTE jobs for selected EU and Non-EU countries.
Table: UK FTE jobs supported (directly and indirectly) by exports to broad destination and selected EU and Non-EU countries, number of FTE jobs and as % of total FTE jobs and FTE jobs supported by exports, 2016
| Export destination | UK FTE jobs (direct + indirect) |
% of total UK FTE jobs supported by exports | % of total UK FTE jobs |
| World | 6,528,000 | 100% | 22.6% |
| EU | 2,790,000 | 42.7% | 9.7% |
| Non-EU | 3,737,000 | 57.3% | 13.0% |
| United States | 1,254,000 | 19.2% | 4.3% |
| Germany | 519,000 | 8.0% | 1.8% |
| France | 375,000 | 5.7% | 1.3% |
| Ireland | 372,000 | 5.7% | 1.3% |
| Netherlands | 360,000 | 5.5% | 1.2% |
| Switzerland | 266,000 | 4.1% | 0.9% |
| China | 190,000 | 2.9% | 0.7% |
| Italy | 190,000 | 2.9% | 0.7% |
| Spain | 166,000 | 2.6% | 0.6% |
| Belgium | 146,000 | 2.2% | 0.5% |
| Saudi Arabia | 129,000 | 2.0% | 0.4% |
| Japan | 126,000 | 1.9% | 0.4% |
| Canada | 111,000 | 1.7% | 0.4% |
| Hong Kong | 107,000 | 1.6% | 0.4% |
| Australia | 106,000 | 1.6% | 0.4% |
| Singapore | 97,000 | 1.5% | 0.3% |
| Sweden | 95,000 | 1.5% | 0.3% |
| South Korea | 71,000 | 1.1% | 0.2% |
| Denmark | 70,000 | 1.1% | 0.2% |
| Poland | 68,000 | 1.0% | 0.2% |
| India | 63,000 | 1.0% | 0.2% |
| South Africa | 54,000 | 0.8% | 0.2% |
| Mexico | 25,000 | 0.4% | 0.1% |
| New Zealand | 16,000 | 0.2% | 0.1% |
Exports to Germany support the largest number of UK jobs of all countries in the EU with the largest number of these jobs being in Manufacturing.
In contrast, the largest numbers of jobs supported by exports to the US are in either Financial and insurance services or Administrative and support services, dependent on the basis of the calculation. Of course, given the dominance of manufactured goods in exporting in general, there are still significant numbers of FTE jobs that are reliant on Manufacturing destined for the US.
Female and male jobs supported
We use the characteristics of the employees in different sectors of the economy to estimate the gender disaggregation of FTE jobs supported by exports.
The share of female employment is often used as a determinant of gender equality within the labour market and has been a topic of discussion for many years now. In 2016, the UK labour market had around 57% (or 16.4 million) FTE jobs filled by men and the remaining 43% (12.5 million) filled by women.
As well as holding more jobs than women, men also benefit disproportionately from exporting activity in the UK. Table 9 shows that male jobs account for two thirds (64%) of all jobs supported directly and indirectly by exports in 2016. Put differently, the share of female jobs that are supported by exports is much lower than that of male jobs; our estimates show that around 19% (2.4 million) of all female jobs are supported directly and indirectly by exports, compared to 25% (4.2 million) of male jobs.
Table: UK FTE jobs supported (directly and indirectly) by exports, by gender, number of FTE jobs and % of total FTE jobs supported by exports, 2016
| UK FTE jobs (direct + indirect) |
% of total UK FTE jobs supported by exports | ||||
| Male | Female | Male | Female | ||
| Direct | 2,366,000 | 1,429,000 | 62% | 38% | |
| Indirect | 1,796,000 | 936,000 | 66% | 34% | |
| Induced | 2,642,000 | 2,151,000 | 55% | 45% | |
| Direct + Indirect
(“Type I”) |
4,163,000 | 2,365,000 | 64% | 36% | |
| Direct + Indirect + Induced (“Type II”) | 6,805,000 | 4,516,000 | 60% | 40% | |
Part of the reason why there are more men than women supported by exports is that, in general, the sectors which have higher export propensity are more likely to be dominated by men. For example, industries that tend to have a higher concentration of male workers such as Manufacturing and Mining and quarrying have a much higher export propensity.
Manufacturing accounted for around 9% of total FTE jobs in 2016, with 77% of these filled by men. In contrast, in industries with a much higher female concentration of FTE workers, such as Education or Health and social work, export propensity is far lower.
Chart: UK FTE jobs supported directly and indirectly by exports in each sector, by gender, ESJ basis, 2016
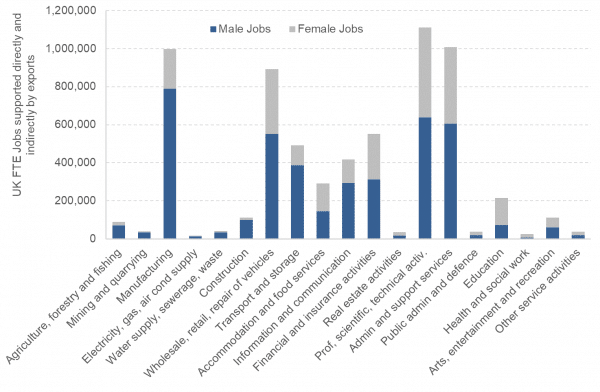
The estimates above show that the distribution of male and female employment supported by exports differs across sectors of the UK economy. The spread across sectors also varies significantly by sector when considering direct jobs vs indirect jobs, as we would expect. In the majority of sectors, direct employment is higher than indirect employment for both genders, a perhaps unsurprising result.
However, there is a small number of sectors that have a higher indirect employment share of total employment for both males and females, including Construction, Transport and storage and Real estate. There are also two sectors in which female indirect employment is higher than male indirect employment. Women account for 16,200 indirect FTE jobs in the Real estate industry, or 51%, with 15,600 indirect male FTE jobs. Similarly, in the Public admin and defence industry, women account for 52% of indirect FTE employment.
Jobs supported in UK nation and region
GVA data were used to apportion FTE jobs to the countries and regions of the UK.
Given the dominance of London in the GVA data, it is not surprising that this region comes out top, with over a quarter (26.3%) of all supported jobs estimated to be in London. Even when correcting for population, the jobs supported by exports in London is still significantly higher than the other regions.
GVA is a workplace–based measure, and therefore GVA in London will be supported by residents from other regions commuting to the area, which should be borne in mind when interpreting figures such as this.
After London and the South East, the region with the next greatest number of FTE jobs supported directly and indirectly by exports is the North West, which reflects its relatively high proportion of manufacturing industries.
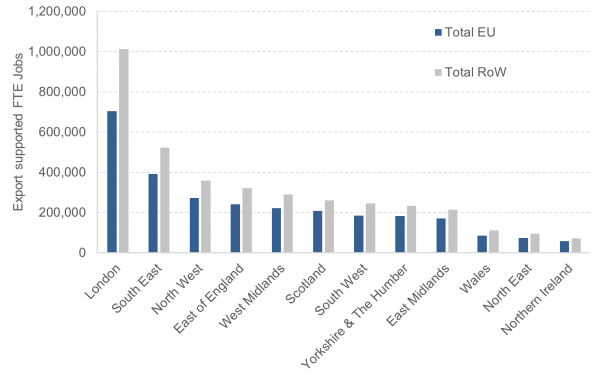
The impact on jobs in the regions and nations of the UK is shown in Chart 9 below. The region that has the most jobs supported by exports to both the EU and RoW is London. Based on its industrial mix, it also has the highest proportion of jobs supported by exports to the rest of the world (59% of jobs supported by exports are supported by exports to RoW). The North West and East Midlands are second and third both with 57.2% of all the jobs supported by exports being supported by exports to the RoW.
In proportional terms, the regions and countries which have the most FTE jobs supported by exports to the EU are Northern Ireland, East Midlands and Scotland with 44.5%, 44.4% and 44.3% respectively. However, it is important to bear in mind that GVA is used to allocate these jobs to regions. Some regions and nations may have stronger or weaker export profiles than this suggests and may also have a different pattern of exports to the EU and RoW.
Chart 9: UK FTE jobs supported (directly and indirectly) by exports, by broad destination and NUTS 1 regions, ESJ basis, 2016
In the accompanying report spreadsheet, there are breakdowns by NUTS 1 region by sector, gender, and broad destination.
The report also includes further findings on age groups, occupation groups, qualifications and further segmentation.
FAQ
Which years does it cover?
This research only examines the jobs supported by exports for the years 2014-2016 due to the long time lag required to produce input-output tables.
Bringing the estimates more up-to-date or ‘nowcasting’ the results is a potential extension to this project, laid out below.
What does and doesn’t this report say?
All estimates relate to existing UK-based jobs (that is, ‘supported’) rather than newly created jobs (‘created’). It does not attempt to predict economic changes due to new trading relationships.
It also does not examine causality. E.g. does exporting lead to the success of businesses, or do successful businesses export, or some mixture of the two.
What are the direct, indirect and induced effects?
In 2016, we estimate that 3.8 million FTE jobs are directly supported by exports in the UK, which represents around 13% of employment in the UK. When adding in the supply chain effects, or indirect effects, this rises to 6.5 million FTE jobs, or 23% of FTE jobs in the UK.
The report focuses on the direct and indirect effects of exporting on UK jobs:
- Direct effects relate to the labour used by exporting firms to produce the exported goods and services
- Indirect effects relate to the labour supported in firms that are within the supply chain of exporting firms
However, the analysis also enables estimation of jobs supported due to the wage spending of those employed directly and indirectly in UK exporting sectors and their UK supply chains. When adding in these induced effects, the number of FTE jobs supported by exports rises to 11.3 million, or 39% of FTE jobs in the UK.
How are these estimates produced?
This project, commissioned by the Department for International Trade (DIT), produces for the first time a comprehensive set of indicators to estimate the aggregate and various distributional impacts of UK exports on the labour market. This allows for an in-depth understanding of the relationship between exports and the labour market in the UK. The indicators are highly detailed and include a large number of sectors, a yearly time series covering the years 2014-16, a large number of trading partners, breakdowns by gender, occupation group, age group, qualifications, and UK NUTS1 region.
The estimates are based on combining data from the Office for National Statistics (ONS) UK input-output (IO) tables and other ONS sources, including Workforce Jobs, the Annual Survey of Hours and Earnings, the Annual Population Survey and Trade in Goods and Services by Industry data. IO modelling provides a useful framework for estimating the impact of exports on the labour market if augmented with additional economic and labour market data. To our knowledge, this is the first attempt internationally to quantify such a comprehensive range of impacts using an IO approach at this level of granularity.
How do they differ from other estimates?
Our estimates differ from other exercises that use the same framework as a building block for producing similar estimates (e.g. OECD) due to differences in methods and the underlying data used. Despite methodological and data differences, our aggregate results come close to the OECD estimates.
Our ‘single-nation’ IO framework has a number of advantages over other exercises that attempt to quantify the impact of exports on the labour market using ‘multi-nation’ IO tables. Single-nation tables require fewer assumptions; are consistent with National Accounts; can be relatively easily augmented with additional data to examine further indicators of interest; and should provide the most robust results. However, international comparisons and analysis of Global Value Chains (GVCs) can only be performed with multi-nation IO tables.
How do they differ from our past estimates of Scotland?
In the past, we have looked at the number of jobs supported by the exports of Scotland. While the overall results are quite close, these data are not entirely comparable.
The reasons for this include:
- These estimates for DIT include offshore oil and gas – of which the majority is allocated to Scotland.
- Different underlying data sources are used.
- The estimates for DIT look at full-time equivalent jobs, whereas our past reports for Scotland use full-time equivalent employment.
- The DIT estimates use GVA splits and do not include the richness of Scotland level data that our Scotland specific results do.
- The previous Scotland estimates did not include supply chain flows that go to the rest of the UK and then return to Scotland.
What assumptions are made?
As with any modelling framework, there are a number of assumptions underpinning the results. The modelling relies on industry averages as we do not have enough information at the firm-level to separate exporting firms from non-exporting firms within an industry. However, evidence suggests that exporting firms are different to non-exporting firms.
On average, they have higher labour productivity and are more import intensive. This will result in the estimates of jobs supported by exports being overestimated. On average, they also pay higher wages which will result in the income supported by exports being underestimated.
Therefore, it is best practice to view the results as having moderately broad confidence intervals, rather than providing point estimates.
We provide recommendations in the report for improving the underlying data which can better account for these assumptions.
How can the estimates be improved?
A large amount of data is incorporated into the modelling to produce the results of this report. Improving the underlying data would significantly improve the quality of the estimates. The report lays out these improvements in full.
Authors

James is a Fellow at the Fraser of Allander Institute. He specialises in economic policy, modelling, trade and climate change. His work includes the production of economic statistics to improve our understanding of the economy, economic modelling and analysis to enhance the use of these statistics for policymaking, data visualisation to communicate results impactfully, and economic policy to understand how data can be used to drive decisions in Government.

Mairi is the Director of the Fraser of Allander Institute. Previously, she was the Deputy Chief Executive of the Scottish Fiscal Commission and the Head of National Accounts at the Scottish Government and has over a decade of experience working in different areas of statistics and analysis.