
It’s less than a week until the Spending Review announcement, and rumours abound about what departments will get in funding and how it ties in with the Government’s priorities.
But how did we get to this system in which departments depend on settlements with the Treasury as part of a broad review of what the government spends its money on? Does it work? How has history influenced it? And what can we expect from next week?
We have today published a paper looking at all this in detail – but here’s a shorter version of the history and a preview for Chancellor Rachel Reeves’ statement.
The Treasury has long been at the centre, and that has not always been great
The system that preceded post-Second World War changes to spending planning and control was set up by William Ewart Gladstone’s Treasury, and had a strong focus on ensuring that expenditure was kept on a tight leash. Parsimony with public funds, annual control of cash and using taxation to balance the needs on public spending were the driving forces of the Treasury, and remained so until the 1950s.
By then, however, Parliament had come to largely ignore its previously central role in setting public spending envelopes. Successive governments had made control of public spending a matter of confidence, and even large changes largely went through on the nod. The Plowden Committee in 1961 proposed a more collective way of deciding on public spending, and its recommendations were largely accepted.
This became the Public Expenditure Survey (PES), which intended to devolve responsibility for planning to departments and to think about what was needed rather than what the envelope as a whole would be. The intention was to limit the Treasury’s influence, which in large part it did.
The 1970s crises bring the Treasury back into the driving seat
But although the PES was well intentioned, it had implementation and incentive problems.
On the implementation side, it was extremely complicated. It required controlling the volume of public services provision, which is as difficult as it sounds. But the lack of constraint on overall spending was its biggest downfall. Although it was meant to reflect economic conditions in the medium-term, there was no mechanism for doing so.
The system was stressed to breaking point during the mid-1970s inflation crisis. The focus on volumes meant that the Government was expected to find additional funds to inflation-proof programmes, but that became impossible with inflation running well above 20% and market participants jittery about sterling and the Government’s finances. From 1976-77 onwards, hard cash limits were introduced, much to the chagrin of many in Harold Wilson’s Cabinet. 1 Horse Guards Road was back in charge of spending.
Cash limits were extremely successful in combating unabated growth in public spending, although of course that came at the expense of being able to deliver all that the Government might have liked to do. The PES formally stayed in place until Gordon Brown’s time in Number 11, but it was for all intents and purposes no longer the tool it had been.
We’re still living with the 1970s spending control architecture
Cash limits are essentially the basis on which Gordon Brown’s Spending Review framework for departmental expenditure limits (DEL) would stand. Since their introduction and success, they have been the way Chancellor after Chancellor has found to push back against demands from departments, and they work in a remarkably simple way. The risk of future demands on spending, particularly for ongoing programmes and costs, is transferred to departments, which then have to trade them off against other pressures that might arise.
Of course, in many cases spending ministers end up in a stalemate with the Chancellor, and end up appealing to the Cabinet or Number 10. But the system is designed for stooshies of this kind – imposing a high bar on ministers to get additional spending, and therefore maintain Treasury control over most areas of spending.
Spending Reviews are big Whitehall events, but they decide less than might appear at first
Since the first spending review in 1998, these have been all-consuming affairs for departments of the UK Government. But they are only a way of divvying up an envelope that’s already been decided: the Chancellor sets it out at the previous fiscal event, and then it’s very much a zero-sum game.
But does this work as a way of controlling expenditure? In a formal sense, yes. There haven’t really been any significant breaches of the control totals, apart from the retrospective Excess Votes due to the outbreak of the Covid-19 pandemic in 2019-20.
On the other hand, one might ask to what extent these limits really are as hard as they seem at first, and therefore to what extent they actually constrain public spending. Even if we exclude the 2019 and 2020 Spending Reviews, for which spending took place during the pandemic and obviously required time-sensitive increases in spending, there is evidence that the Government has topped up budgets significantly during spending review periods.
Chart 1 shows the annual increases in limits set to departments in nominal (i.e. in cash) terms. This is what spending reviews should be good at: passing on the risk to departments by setting cash budgets, which mean that each area needs to then manage competing demands within a set limit.
Instead, what we see is that apart from the austerity years – in which cuts actually exceeded plans – spending growth has been consistently higher than that projected in each spending review. The gap has grown over time, with spending in the SR 2015 period more than three times that planned by George Osborne, largely as a result of Philip Hammond’s looser policy. Growth in the SR 2021 period has also been twice as fast as Rishi Sunak intended as Chancellor, even with him eventually stepping into Number 10.
Chart 1: Nominal annual increases in departmental expenditure limits in each SR period
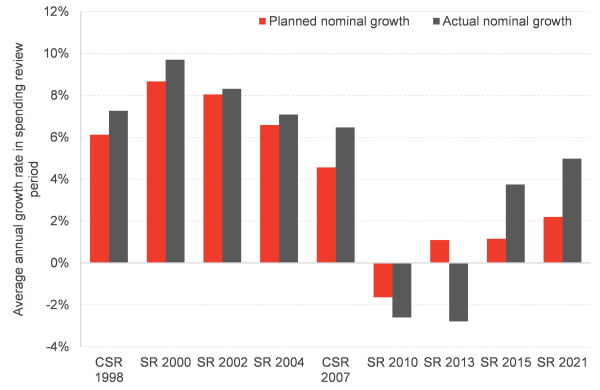
Source: HM Treasury, OBR, FAI analysis
This consistent pattern of top-ups and policy between spending reviews is not really surprising. In some sense, it merely reflects the fact that the spending review process – for all the work it generates in Whitehall – is not actually a major macroeconomic event. That place is taken by Budgets and Summer/Autumn/Fiscal Statements (Winter has so far been avoided in the title, presumably to avoid headlines writing themselves in the case of bad news), in which the Chancellor does actually have to balance tax, spending and borrowing in line with political, economic and market conditions. All that is absent from a spending review.
What about real-terms spending?
When the PES was introduced, it was meant to be a solution to the excessive control exercised by the Treasury, which created a barrier to expansion based on population demands for additional government provision of goods and services. In particular, the planning system was changed to be on the basis of volumes rather than prices; the Government would decide what it needed to do in terms of quantities, and would then provide funding for any inflation effects.
This is largely what caused the loss of control over spending in the 1970s, resulting in the imposition of cash limits. Of course, what this actually meant was that if inflation was below forecast, departments would be able to increase spending within that envelope and provide more goods and services. But if it were higher than forecast, then departments would have to live within their limits and cut provision. Essentially, the inflation risk was outsourced to departments.
Chart 2: Real-terms planned and actual spending by departments during each SR period
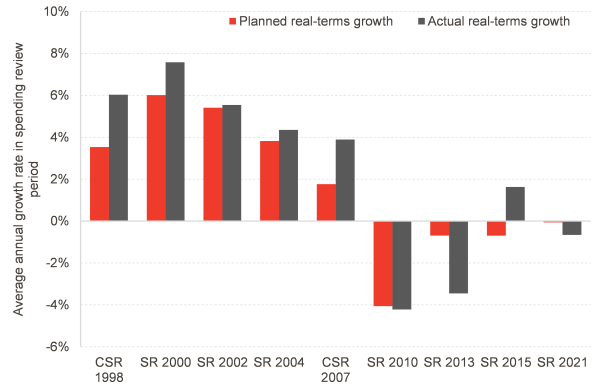
Source: HM Treasury, OBR, FAI analysis
In fact, that is largely the pattern that we see since the 1998 CSR. Chart 3 shows this in more detail, breaking down the difference between planned and actual real-terms spending into an inflation effect and the provision of additional funding by the government in periods after the spending review. Note that the inflation effect is positive when inflation is lower than forecast – that is, lower inflation frees up funding for higher increases in real-terms government spending.
Chart 3: Breakdown of difference between planned and actual real-terms increases in spending during SR periods
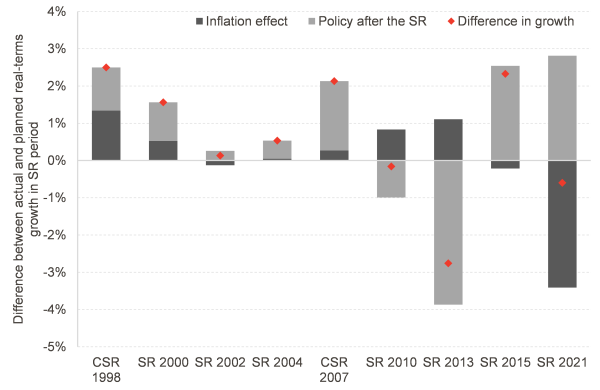
Source: HM Treasury, OBR, FAI calculations
In the period after the 1998 and 2000 spending reviews, inflation was significantly lower than forecast, which allowed the UK Government to increase spending considerably above what it had planned originally. But even then it also engaged in significant top-ups during the SR period, meaning that the pattern of not sticking to the announced limits has been a feature of the system since its introduction.
The austerity years also show that the Osborne Treasury used lower than predicted inflation to slash spending more aggressively, essentially offsetting any loosening that could have come from that inflation surprise. It also cut aggressively the totals for 2015-16 after the SR 2013.
The Hammond loosening is very evident in this chart as well, bringing annual growth in spending to 2.3 percentage points above Osborne’s plans from 2015. And finally, the return of the inflation erosion of the purchasing of departmental budgets is clear from the SR 2021 bars. Jeremy Hunt increased totals in his budgets, but not by enough to mitigate the inflation effect: spending fell by 0.7% a year in real terms, compared to the already significantly tight 0.1% fall pencilled in by Rishi Sunak.
What can we expect next week?
As we’ve outlined above, the envelope for the 2025 Spending Review has been set since March. There may be some small movements either way, but ultimately it will be very close to what the Chancellor included in her plans at the Spring Statement and the OBR scored in its Economic and Fiscal Outlook.
We’ll focus on RDEL, which is day-to-day spending and therefore the most crucial allocation for public service delivery in the short-run. Table 1 shows just how uneven the profile is for growth in spending: slower in 2026-27 already, and down to only 1% a year from 2027-28 onwards.
Table 1: RDEL allocations from the Spring Statement 2025 and Main Estimates 2025-26
| 2024-25 | 2025-26 | 2026-27 | 2027-28 | 2028-29 | |
| RDEL (£bn) | 487.5 | 514.8 | 535.5 | 551.6 | 567.7 |
| Assumed RDEL excluding international aid (£bn) | 476.5 | 502.6 | 529.0 | 544.9 | 560.8 |
| Real-terms growth | 2.9% | 2.3% | 1.0% | 1.0% | |
| Real-terms growth excluding international aid | 2.8% | 3.5% | 0.9% | 1.0% |
Source: HM Treasury, OBR, FAI analysis
The totals in the Spring Statement already had the shift from international aid to defence spending, which when we put it all together actually leaves slightly more room for manoeuvre in the first year of the Spending Review on the resource side for all other departments than might seem at first.
But that is very much short-lived. And with the health service, schools and defence likely to be boosted in real terms, it leaves a very difficult settlement for the final years of the Spending Review.
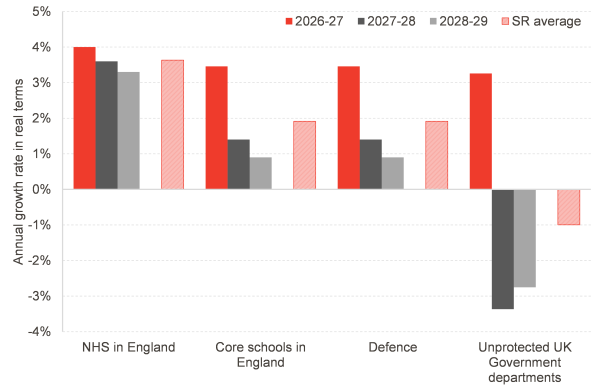
Chart 4 illustrates a plausible scenario in which the English NHS sees an increase of 3.6% a year in real terms, with schools and defence also seeing around a 2% boost a year. None of these are historically large, but even this mild scenario would leave unprotected departments having to cut spending significantly, by 1% a year in real terms. This would fall disproportionately on 2027-28 and 2028-29, as there is a significant boost in the first year. It might mean 2.5% to 3.5% cuts a year in real terms in two consecutive years.
In this scenario, the Scottish Government’s block grant would mechanically move similarly to the overall envelope. This is because many of the changes to unprotected departments lead to Barnett consequentials, but so do the larger boosts to health and education, which offsets those changes.
Chart 4: Illustrative RDEL scenario for the Spending Review based on announced policy and total envelope
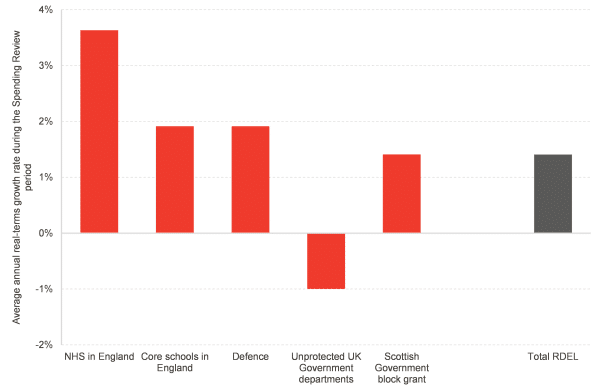
Source: FAI analysis
It is of course for the Chancellor and the UK Government to decide on the path of public spending – and it might well choose different paths for spending. But chart 5 is not an implausible extrapolation of the figures that are already in the OBR forecasts and which guide the Spending Review totals.
And it does not look like a particularly deliverable plan. It promises a sort of ‘mañana austerity’, with strong growth in spending for another year while continuing to promise to cut spending at pretty heroic rates in a few years’ time. In fact, it’s almost a perfect reverse image of what then-OBR Chairman Robert Chote termed George Osborne’s spending ‘rollercoaster.’ Maybe we’re just on a different section of the ride.
Chart 5: Implied annual real-term growth rates from the illustrative RDEL scenario for the Spending Review
Source: FAI analysis
But as chart 3 showed, spending reviews are far from the only time at which fiscal policy is announced. A cynic might suspect that the Chancellor knows this and is planning on finding a way of not having to deliver those planned cuts in 2027-28 and 2028-29 – perhaps by hoping for economic growth to bail her out, or raising taxes significantly at a coming budget. Either way, she’ll want to avoid trade-offs on public services that are hard to stomach.
But that seems to be for another day, may even another year. Augustinian fiscal policy is alive and well.
Authors

João is Deputy Director and Senior Knowledge Exchange Fellow at the Fraser of Allander Institute. Previously, he was a Senior Fiscal Analyst at the Office for Budget Responsibility, where he led on analysis of long-term sustainability of the UK's public finances and on the effect of economic developments and fiscal policy on the UK's medium-term outlook.