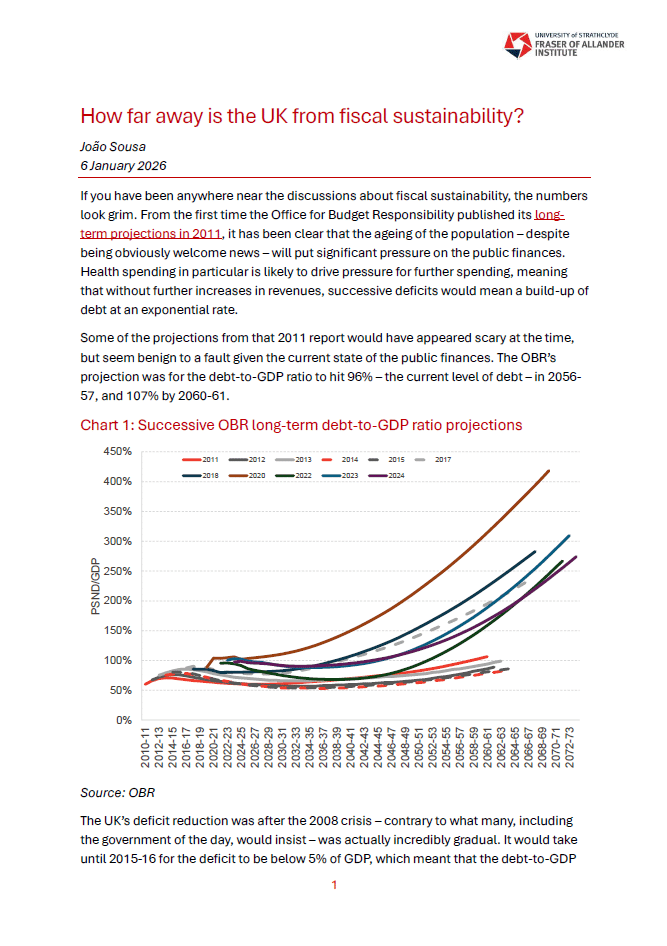
If you have been anywhere near the discussions about UK fiscal sustainability, the numbers look grim. Ever since the OBR first published its long-term projections in 2011, it has been clear that the ageing of the population – despite being obviously welcome news – will put significant pressure on the public finances.
Health spending in particular is likely to drive spending up considerably, and without further increases in revenues, successive deficits would build up debt at an exponential and unsustainable rate. The OBR’s latest projections have debt growing to over 270% of GDP.
Chart 1: Successive OBR long-term debt-to-GDP ratio projections
Source: OBR
A mountain too far?
Faced with such a seemingly insurmountable challenge, it is easy to feel disheartened. Faced with such a seemingly insurmountable challenge, it is easy to feel disheartened. Surely whatever we do, debt will explode?
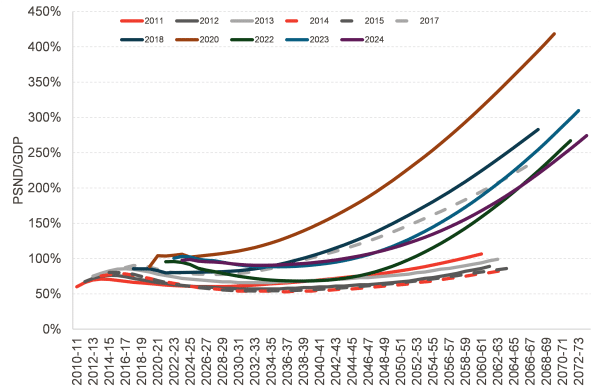
And yet you’d be forgiven for thinking all is normal in financial markets. But if this is not privileged information, why would anyone buy 50-year-dated gilts, let alone at a higher price than shorter-dated ones?
Chart 2: UK yield curve on 24 December 2025
Source: MarketWatch, FAI analysis
There are four main arguments that can be made for this set of circumstances:
- The projections really are the most likely scenario, but market agents have not taken account of them or have discounted them. This seems implausible and unsatisfactory: it essentially requires believing that sophisticated agents tasked with a lot of liquidity and a job of matching assets and liabilities have for decades behaved far from rationally. One should always be at the very least sceptical of ascribing irrational behaviour in such a grand scale.
- The UK does face an impending fiscal crisis, but so does every other advanced economy, and therefore what matters is the UK’s relative position. In this view, investors need some form of Government debt holdings for long-term hedging, in which case they are willing to buy these securities even though they are essentially unfulfillable in any meaningful way. But this is also unsatisfactory as an explanation: it implies a sort of nihilistic self-deception that denies market participants any real agency. No one is truly forced to buy 50-year-dated gilts – they could instead buy other assets that may not be perfect substitutes, but would be substitutes to some degree, such as shorter-dated assets. But remember that 50-year gilts are more, not less expensive than shorter-dated ones, which this explanation does not address.
- The UK does face an enormous fiscal adjustment, but politicians and society will tackle it when they need to; or
- A fiscal adjustment of some magnitude is needed, but is perhaps less severe than it appears in these projections.
The OBR’s assumptions on indexation matter a lot – and worsen the projections considerably
The OBR is required to model long-term projections on the basis of unchanged policy. To do so, it assumes that after the medium-term forecast period, income tax thresholds will go up in line with average earnings.
This essentially turns off fiscal drag, preserving the tax rates paid by the end of this decade in perpetuity.
We’ve all become accustomed to talking about fiscal drag because of the threshold freeze recently extended by Rachel Reeves. But even under the default indexation mechanism (CPI inflation), fiscal drag still happens, because earnings tend to go up more quickly. Fiscal drag is a feature, not a bug, of the income tax system.
The OBR, for their part, recognised this in their 2011 Fiscal sustainability report, stating that “this definition of unchanged policy would result in the average tax rate rising steadily over time as people find more of their income falling into higher tax bands” and that “[p]revious long-term analyses, including the Treasury’s Long-term public finance reports (LTPFRs), have recognised that this fiscal drag could not be assumed to continue indefinitely”.
Is it really true that this cannot go on forever?
Fiscal drag is indeed very powerful, and continues to raise significant amounts of tax. But – not to go all Mick McCarthy – but that does not imply it can’t go on like this.
The long-term projections are meant to illustrate the public finances under unchanged policy. Average earnings indexation is not current policy, so by definition it cannot be unchanged policy. CPI indexation is.
This leaves us with a much more realistic conclusion that fiscal drag is built into the system by design and that normal income growth raises tax rates over time.
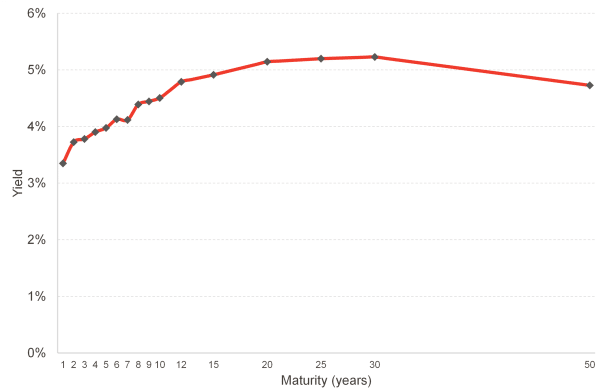
This would be a radical reshaping of the income tax system, going from a marginal rate on the average income of 20% to 45%. And yet it is what is implied by the default indexation mechanism.
Chart 3: Projected average earnings and thresholds under CPI and average earnings indexation
Source: OBR, FAI analysis
If we allow for fiscal drag – which is built into the system – taxes are already projected to go up significantly over time
The OBR’s 2024 projections – as indeed all its previous projections – have tax revenues falling slightly over time as a share of GDP. This is because of a smaller share of the population being of working age, thus reducing National Insurance Contributions, while the remaining taxes remain broadly constant as a share of national income. A further c.1% of GDP fall has recently been incorporated to account for the loss of fuel duty due to the electrification of the vehicle fleet.
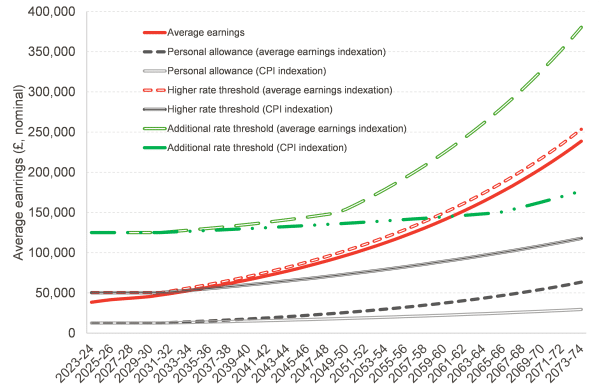
But if we account for fiscal drag, the reality is significantly different: primary receipts (that is, excluding interest and dividend receipts) as a share of GDP would instead rise from 40.2% in 2029-30 to 48.6% in 2073-74.
This would be an increase of 8.4% of GDP, or £250 billion a year in today’s terms. This is of course a huge increase – but remember that fiscal drag is baked into the system. An increase of this magnitude is what would happen in the absence of changes to government policy.
Chart 4: Primary receipts until 2073-74 assuming fiscal drag and otherwise OBR assumptions
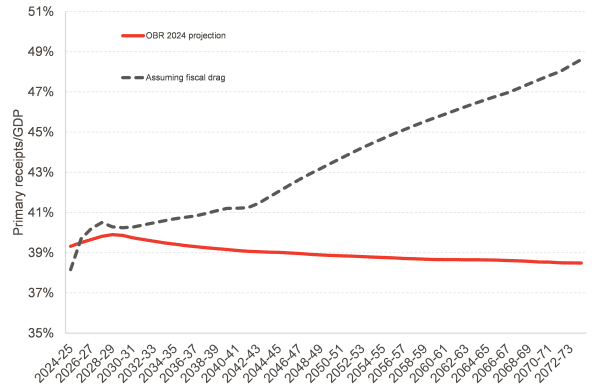
Source: OBR, FAI analysis
Default indexation for welfare spending too is CPI inflation
Here too the OBR assume indexation by average earnings. In the original 2011 FSR, the OBR state that “uprating working-age benefits in line with prices rather than average incomes over the long term would see the value of those benefits shrinking steadily relative to the living standards of the bulk of the population.”
There’s no disputing that income replacement provided by benefits would decline over time if indexation were to be done only in line with prices. But that’s exactly what has been happening for the past 50 years. Apart from the state pension, welfare payments are uprated with price inflation, which has been much lower than earnings growth. This is why the income replacement rate from unemployment benefits, for example, has fallen from 28% in 1965 to just 12% today.
Chart 5: Unemployment benefits[1] as a share of average weekly earnings
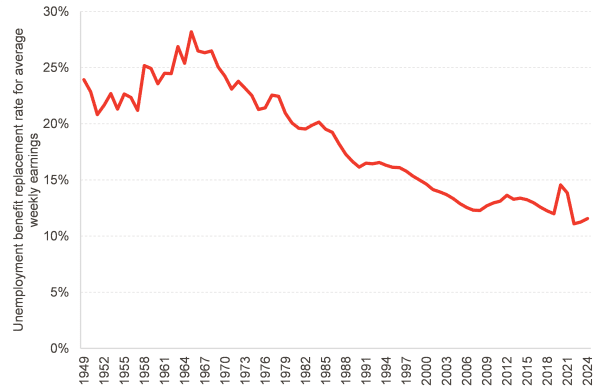
Source: FAI calculations using data from DWP, Bank of England, OBR, ONS
The erosion of welfare spending as a share of average earnings is a feature, not a bug of the default indexation mechanism, and it is pretty hard to argue why it shouldn’t be taken as the basis for unchanged policy, even if leads to some stark conclusions. On the contrary – uprating benefits by average earnings would seem a pretty large change in policy.
The real culprit of the fiscal sustainability problems is poor productivity growth
This has been recognised by the OBR in their medium-term productivity forecasts, with a 0.25 percentage point decrease in potential growth incorporated into the 2025 Budget numbers.
But even that seems on the optimistic side. Britain has been averaging around 0.5% ever since the 2008 Financial Crisis. Even if we give the current government some credit for planning reforms and increased investment, 0.7% seems the more realistic figure.
Chart 6: 10-year moving average growth in productivity per worker since 1970
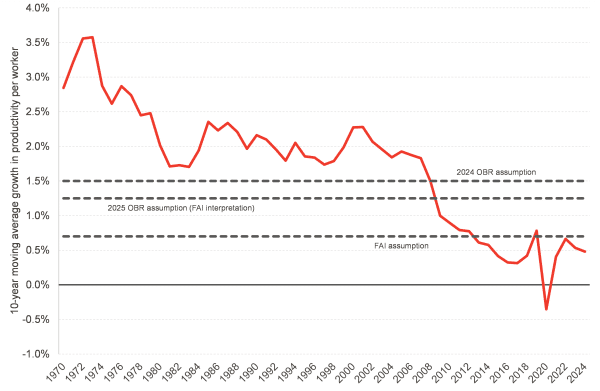
Source: ONS, FAI analysis
Incorporating this lower growth figure – and a less beneficial ‘R-G’, or growth corrected interest rate on the national debt – shows that debt really does rise exponentially still, but driven by poor productivity performance instead of artificially low tax rates.
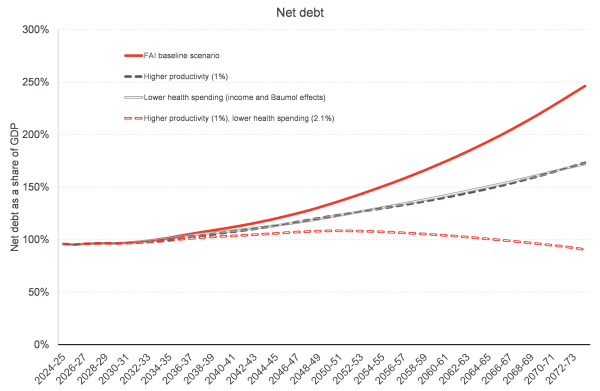
Chart 7: Long-term debt projections accounting for different indexation and productivity assumptions
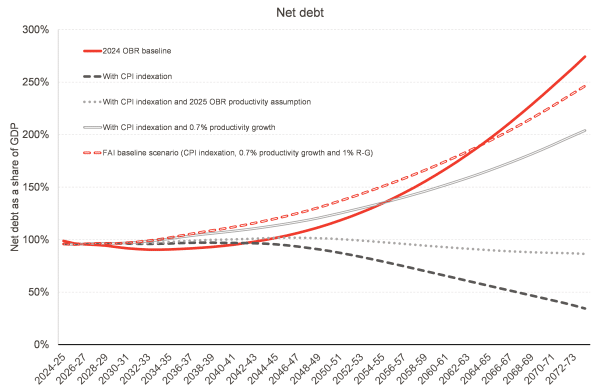
Source: OBR, FAI calculations
The good news is that the action needed to make the UK public finances sustainable is not as drastic as it may seem
And that’s because, once we take this lower indexation path into account as the baseline – the ‘do nothing scenario, given current government policy – the changes needed to put the public finances on a non-exploding debt path are rather smaller than they appear in the OBR projection. And it’s because a large increase in taxes is already baked in over the long term by design.
Because fiscal drag does so much, only two of the following three appear to be necessary:
- Modestly raising productivity growth, to around 1%;
- Moderately bearing down on health spending growth through non-demographic cost pressures;
- A small increase the basic rate of income tax, to the levels of the late 1990s (23% instead of the current 20%).
Chart 8: Long-term debt projections under different scenarios for productivity growth, health spending and tax rises
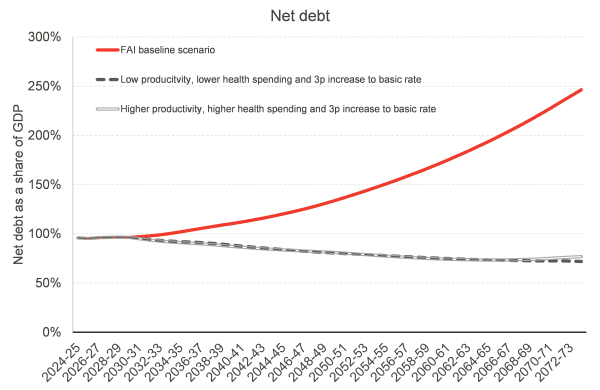
Source: FAI calculations
Of course, these are only illustrative projections, but our objective is to move the conversation beyond a place where it seems like perpetually rising debt is destiny. There are challenges, and solving the debt sustainability issue will require government action – be it through improving productivity growth, tackling non-demographic costs in the health service or raising taxes.
But this hopefully serves a starting point on the move away from fatalism and towards a more productive conversation about the different paths available to the UK Government.
But this is and will remain a knife-edge problem: small changes cumulate over time to have dramatic effect, and can lead to either a steady downward path for debt or an unsustainable explosion.
It is genuinely good news that the change needed is not as substantial as it might initially appear. But the narrow window for a sustainable debt path also means that it needs continual monitoring and adjustment if economic conditions change.
What do these projections mean for Scotland?
Look out for our upcoming Budget Report, which will be published in the coming days. In it, among other things, we will explore what the UK Government taking these actions would mean for fiscal sustainability in Scotland in the framework used by the Scottish Fiscal Commission.
Interested in reading more about the modelling underpinning this blog?
Find the full paper on the left-hand side, including the full list of assumptions used and how they differ from the OBR’s.
————————————————————————————————————————–
[1] Specific unemployment benefits separate from other benefits no longer exist since non-contributory jobseeker’s allowance was replaced by universal credit. This calculation uses the standard rate of UC as the analogous benefit, and includes the additional £20/week pandemic boost to the standard rate.
Authors

João is Deputy Director and Senior Knowledge Exchange Fellow at the Fraser of Allander Institute. Previously, he was a Senior Fiscal Analyst at the Office for Budget Responsibility, where he led on analysis of long-term sustainability of the UK's public finances and on the effect of economic developments and fiscal policy on the UK's medium-term outlook.