
Energy prices had previously been frozen for two years from October 2022 in the “mini budget” at £2500 per year for the typical household.
While the price cap is remaining in place this winter it has been made less generous in 2023 and onwards. From April, energy prices will be capped at £3,000 instead of the prior £2,500.
What does this mean for households?
Annual energy bills will be increasing from April 2023 onwards.
The typical household can expect their annual energy bill to increase from £2,500 currently to £3,000 in April 2023 and remain at this point for another twelve months. Note that your own household bill may be higher or lower than the typical bill depending on energy use.
In addition, the Energy Bills Support Scheme, which is currently reducing each household’s bill by around £66 per month, will be finishing in March 2023.
For example, if your household electricity and gas bill was £250 in October 2022, you should expect your bill in October 2023 to be around £366*.
If your household electricity and gas bill was £200 in April 2022, you should expect your bill in April 2023 to be £304 **.
The UK Government has, however, announced additional support for households on means-tested benefits, pensioner households, and recipients of extra-costs disability benefits.
* £250 x 1.2 + £66 = £366.
** £200 x 1.52 = £304.
How distributive is the Energy Price Guarantee?
Clearly those on the lowest incomes will spend a higher proportion of their income on energy bills.
Data from the ONS Living Cost and Food Survey shows that households in the lowest ten percent of incomes spend over 8% of their weekly costs on energy bills. Meanwhile, energy bills make up just over 3% of expenditure for the wealthiest.
However, higher income households use significantly more energy overall. Households in the highest 10% of incomes spent almost twice as much on electricity and gas as households in the lowest 10% of incomes (£31.90 vs £16.90 per week in 2020-21 – with values now looking increasingly dated).
The biggest absolute beneficiaries of the Energy Price Guarantee are therefore the wealthiest. This is a drawback of large, untargeted packages of support.
Chart 1: Average weekly expenditure on electricity, gas & other fuels by household income decile, 2020-21
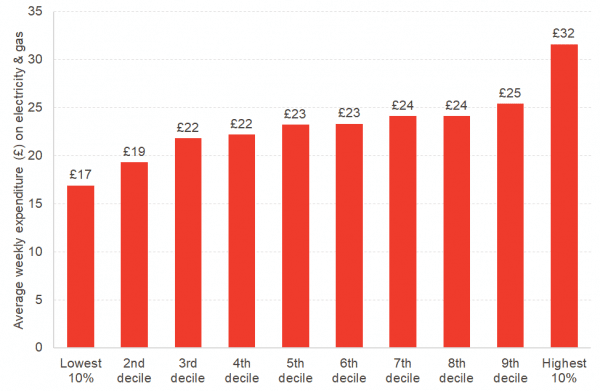
Source: ONS Living Cost and Food Survey
How much will this cost the UK Government?
The other drawback of large, untargeted support is the cost.
The reduction in generosity in the Autumn Statement has cut the cost to the government in more than half, falling from a cost of £26.8 billion to £12.8bn for the year 2023-24 and removing the £3.7bn cost in 2024-25.
The total cost of the Energy Price Guarantee from October 2022 onwards has therefore fallen from £55.3bn to £37.6bn.
What might have happened without intervention?
Table 1: Forecast typical annual energy bill under a no intervention scenario, the Mini Budget and the Autumn Statement
| Scenario | 2022 | 2023 | ||||||
| Q1 | Q2 | Q3 | Q4 | Q1 | Q2 | Q3 | Q4 | |
| No intervention | 1277 | 1971 | 1971 | 3549 | 4255 | 3702 | 3158 | 3182 |
| Mini Budget | 1277 | 1971 | 1971 | 2500 | 2500 | 2500 | 2500 | 2500 |
| Autumn Statement | 1277 | 1971 | 1971 | 2500 | 2500 | 3000 | 3000 | 3000 |
Sources: OFGEM, HM Treasury, Cornwall Insight
Without the Energy Price Guarantee, the average annual cost of electricity and gas for a typical household would have risen to £3,549 in October 2022, up 80% from £1,971.
The Energy Price Guarantee limited total inflation (CPIH) over a 12 month period to 9.6% in October 2022. Without the guarantee, inflation would have been 2.6 percentage points higher.
Cornwall Insight’s forecasts suggest that, without the Energy Price Guarantee, energy prices would have continued to rise. They are forecast to peak at £4,255 in the first quarter of 2023 – more than tripling over the year – before starting to fall.
Under this “no intervention” scenario, electricity and gas contributes to a 4.8 percentage points of CPIH inflation in October 2022 and contributes to 6.2 percentage points of inflation in January 2023.
Considering the price rises of other goods and services, inflation would likely have been exceptionally high going into 2023. The OBR forecasts CPI 12 month growth of 13.6% in Q1 2023 without the Energy Price Guarantee.
Chart 2: Contribution of electricity and gas to 12 month CPIH inflation in a “no intervention” scenario
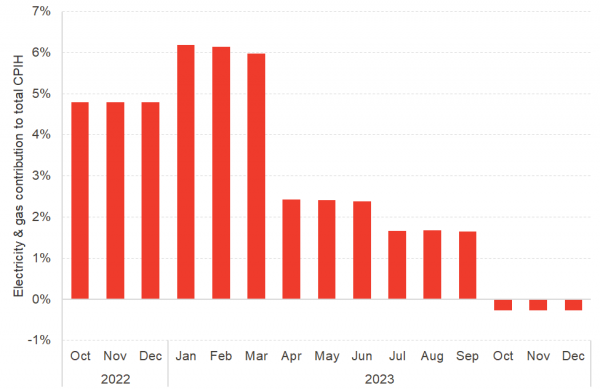
Source: Fraser of Allander Institute
How might Autumn Statement changes to the Energy Price Guarantee affect headline inflation?
One reason that the UK Government has chosen to cap prices rather than extending the £400 Energy Bills Support Scheme (EBSS) was due to classifications.
The ONS ruled that the EBSS payments should be classified as a transfer by central government to households rather than a reduction in prices. This meant that the EBSS payments had no impact on headline CPIH or CPI inflation rates.
Conversely, the Energy Price Guarantee directly caps bills and therefore does impact on headline inflation rates. The OBR forecasts that it reduces the peak CPI inflation rate from 13.6% to 11.1%.
Where this gets complicated is how this affects overall inflation as the cost of electricity and gas start to fall. Inflation is measured in terms of growth. As electricity and gas prices start to fall, the more that electricity and gas costs today, the greater the fall in the inflation rate.
Without any intervention, typical annual energy prices are forecast to fall from £3,549 in Q4 2022 to £3,182 in Q4 2023, a reduction of £367. Under the Energy Price Guarantee, energy prices will instead rise over the period from £2,500 to £3,000.
The likely impact of the Energy Price Guarantee on inflation is that it will reduce the height of the inflationary peak but stretch some of this difference in inflation out over a longer period.
The OBR estimates that inflation will return to more normal levels around Q4 2023 and the economy will then fall into a period of deflation, driven primarily by falling energy prices.
Chart 3: Contributors to CPI inflation rates with and without the Energy Price Guarantee
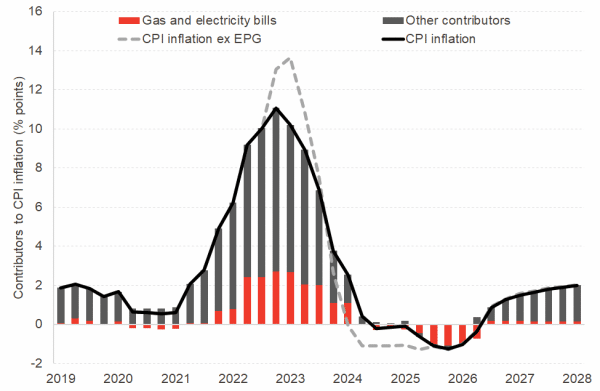
Source: OBR
Despite Government support saving many households hundreds of pounds over the coming year, few will be feeling particularly lucky. Electricity and gas prices have increased significantly amongst a backdrop of rising food prices and rent.
The cost of living crisis is now in full swing and an impending recession is likely to dampen any Christmas sprit among even the most optimistic economists.
Authors

James is a Fellow at the Fraser of Allander Institute. He specialises in economic policy, modelling, trade and climate change. His work includes the production of economic statistics to improve our understanding of the economy, economic modelling and analysis to enhance the use of these statistics for policymaking, data visualisation to communicate results impactfully, and economic policy to understand how data can be used to drive decisions in Government.