Just before Christmas, the Scottish Government published updated experimental statistics on Scottish Gross National Income (GNI).
Remember, as we set out in May when these figures were first published, GNI statistics are interesting for a number of reasons – not least as they can add some insight into how much income is retained in Scotland relative to how much the country produces in a given year.
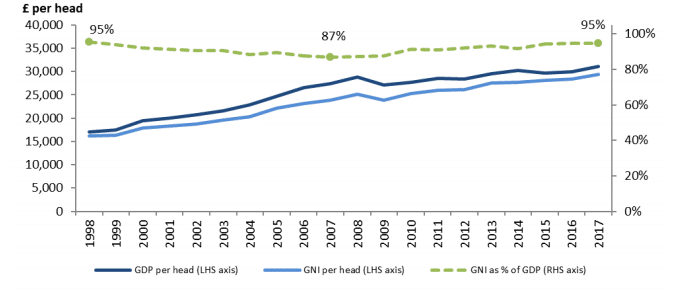
The latest figures show that Scottish GNI was estimated to be around £29,350 per head in 2017.
But the figures also show that Scottish GNI was estimated to equal 94.5% of Scottish GDP.
In other words, there continues to be a net outflow of income from Scotland to the rest of the UK and/or overseas. Indeed over the entire period of the data reported by the Scottish Government (i.e. 1998 to 2017), Scottish GNI has remained below GDP.
A quick recap – what is GNI and how does it compare to GDP?
GNI provides a measure of a country’s total national income. It includes all the income earned by a country’s residents and businesses at both home and abroad. It contrasts with GDP which measures the income of anyone within a country’s boundaries, regardless of who produces it.
That is, GNI tends to be based upon ownership, whereas GDP is based on location.
An example might help with the understanding.
Suppose that an overseas firm chooses to invest in Scotland to manufacture a new product. This production will be counted in Scottish GDP. But if the firm’s owners take the profits and repatriate them to overseas shareholders then this will not be counted in Scottish GNI. The people of Scotland don’t benefit from these profits when they are sent overseas.
Of course, the reverse also holds. Should a Scottish firm invest abroad – e.g. take-over a manufacturer in Sweden – and bring back profits to Scotland, then this will add to our GNI.
For many countries, GNI and GDP are close to one another. But for others, there can be significant differences. Ireland and Luxembourg are perhaps the two most obvious examples where this is the case. For example, Ireland benefits from a number of multi-nationals operating out of Dublin. The activity of these firms significantly boosts Irish GDP. But in reality, quite often only a fraction of this activity makes its way into the incomes of the Irish people. Instead, the profits are transferred back to head-offices and investors in the US and elsewhere.
The latest GNI figures for Scotland
It should be noted that the estimates of Scottish GNI come with a health warning. They are experimental statistics.
Whilst exact data on many aspects of the calculations required for GNI are not available, the estimation methodologies applied by the Scottish Government seem entirely appropriate and the best available for the time being.
That being said, specific point estimates should still be treated with a degree of cation.
The latest figures cover up to 2017. They show that –
- Scottish GNI was estimated at £159.3bn (£29,357 per head) compared to Scottish GDP of £168.5bn (£31,055 per head).
- In other words, Scottish GNI was estimated to equal 94.5% of Scottish GDP.
This means that there is a net outflow of income from Scotland relative to what is produced here.
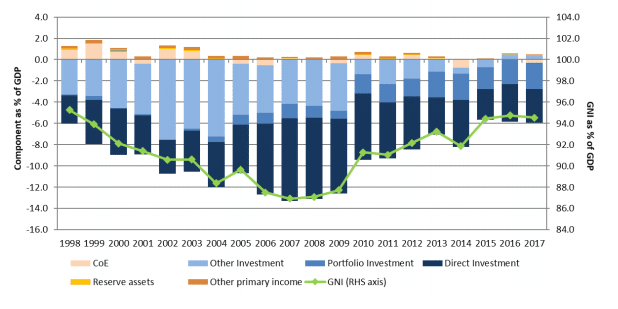
The chart below shows the time path of GNI as a share of GDP over time, broken-down by income component.
Figure 1: GNI as % of GDP and contribution of primary income account components, 1998-2017

Source: Scottish Government
As the chart highlights, through the entire series GNI has been lower than GDP – reaching only 87% of GDP back in 2007.
The statistics show a relatively consistent pattern. Scotland has had a net outflow of income both to the rest of the UK and the rest of the world.
A BRIEF ASIDE
Work with us
We regularly work with governments, businesses and the third sector, providing commissioned research and economic advisory services.
Find out more about our work as economics consultants.
What does this tell us about the balance of the Scottish economy?
These estimates of GNI confirm that Scotland is a wealthy country.
Of course like GDP, GNI is not a perfect measure of ‘economic prosperity’. For example, it doesn’t capture how income is shared across society.
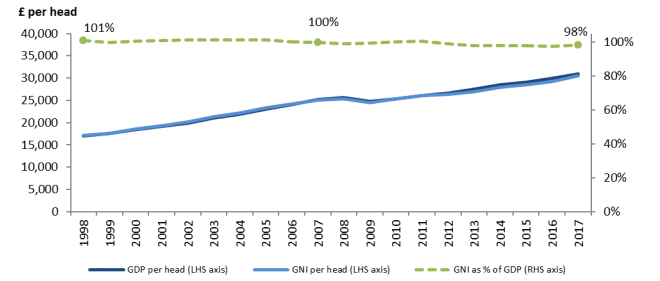
Like most other indicators of economic performance, the statistics show that Scotland’s GNI per head is broadly in line with the UK as a whole (although slightly lower).
There is less of a discrepancy between GNI and GDP in the UK than in Scotland. This is due in part to the fact that the financial outflows associated with North Sea operators have a proportionately smaller impact on UK GNI than they do for Scotland – see figures 2 and 3.
Figure 2: GDP and GNI per head and GNI as % of GDP, Scotland, 1998-2017

Source: Scottish Government
Figure 3: GDP and GNI per head and GNI as % of GDP, UK, 1998-2017

Source: Scottish Government
As we highlighted in May, the statistics also reveal some important questions about the balance of the Scottish economy.
The fact that GNI is lower than GDP suggests that that the amount of national income being retained for the benefit of the people of Scotland is lower than the value of what is being actually produced here.
There are two important interpretations of this.
First, given the importance of the Scottish financial industry to the economy we shouldn’t be surprised that there is a net outflow of income from Scotland. If a Scottish investment firm is successful, then the inflows of investor income that they bring in to Scotland and then turn into a profit should always be lower than outflows (i.e. they are earning their investors’ money).
But second, the figures highlight long-standing debates around the balance of Scotland’s economy and the ownership of the profits made here – see the work of Jim and Margaret Cuthbert over many years.
For example, whilst the North Sea has undoubtedly had a major positive impact on Scotland’s economy, the high level of overseas ownership amongst oil and gas operators means that many of the profits have in the past flowed out of Scotland. The influence of the North Sea on the figures has lessened since the height of investment in the North Sea. In 2012 for example, the North Sea accounted for over 50% of the balance of income, and this fell to just over 10% in 2015.
The predominance of company headquarters outside of Scotland – not helped by the loss of many Scottish truly domiciled firms in recent decades – has meant that a higher level of profits arguably flow out of Scotland than would be otherwise be the case. Indeed, many of Scotland’s largest firms – not just oil and gas and financial services but petrochemicals, professional services and whisky – are owned outside of Scotland. So although the products or services may be made here, the income doesn’t always stay in Scotland. .
In general, foreign investment into Scotland is often seen as a good thing – and it helps companies to grow and create jobs. It’s also something that successive Scottish administrations have actively encouraged – see, for example, the hype that often accompanies the EY Report on FDI every year. However, this will also have the consequence that some of these increased earnings will flow out of Scotland as investors earn returns on their investments and therefore widen the gap between GDP and GNI..
With the rise of digital technology and major multi-national firms such as Google, Amazon and others this issue is only likely to become even more important in the future – particularly where tax revenues are involved. This ongoing data work from the Scottish Government should help to inform such debates.
Authors

Graeme Roy
Dean of External Engagement in the College of Social Sciences at Glasgow University and previously director of the Fraser of Allander Institute.
Mairi is the Director of the Fraser of Allander Institute. Previously, she was the Deputy Chief Executive of the Scottish Fiscal Commission and the Head of National Accounts at the Scottish Government and has over a decade of experience working in different areas of statistics and analysis.
