There has been widespread discussion over the weaknesses of ‘traditional’ metrics such as GDP to track economic performance.
In the long-run, whilst GDP can be correlated with better ‘outcomes’ – including living standards – it does not capture how any improvements are shared across society. Moreover, whilst a growing economy can help deliver technological benefits and better public services, GDP doesn’t tell us whether or not such growth is environmentally sustainable.
In July, the First Minister provided a TED talk “Why governments should prioritize well-being”. The talk, viewed over 1 million times, attacked GDP as a tool for policymakers.
Such an argument isn’t new, or limited to one side of the political spectrum. FM’s speech was similar to a speech by David Cameron in 2010. In his speech, he stated that “I do think it’s high time we admitted that, taken on its own, GDP is an incomplete way of measuring a country’s progress.”
So what are the alternatives?
Recap on GDP
The debate surrounding GDP has resulted in discussions of an alternative measure – one which shows how growth is spread and how it is created.
The argument goes that rising GDP has not been matched with rising levels of contentment and economic growth alone fails to capture a “huge part of wellbeing”.
However, it’s important to remember that many of the problems don’t rest with GDP itself, but on how it is interpreted.
It tries to measure what is produced within an economy. No more, no less.
Of course, it has technical flaws – including trying to measure the modern digital economy, capturing improvements in ‘quality’ (e.g., a new iteration of an I-Phone), or in accounting for activities – such as caring responsibilities – that individuals can either do themselves or go to the market for.
But to criticise it for not measuring how income is distributed, or the amount of pollution created, or some broader indicator such as ‘wellbeing’, is clearly to blame it for something that it isn’t designed to measure.
So instead the criticism is levied at policymakers who “focus their attention only on growing GDP”. But is this entirely fair?
Yes and no.
There is clearly an opportunity to emphasise wider indicators when evaluating different policy options – for example, in deciding what type of infrastructure to invest in. And at a macro level, there is a need to broaden our assessment of what constitutes ‘success’ – for example, focusing less on GDP growth and more upon household income growth.
But then again, the idea that policymakers only ever care about GDP is clearly wrong. We can’t think of any time the Scottish Government – past or present – has ever focussed solely upon GDP and not levels of inequality, improvements in healthy life expectancy, better housing, higher earnings, lower levels of poverty or a better environment.
Even a quick skim of the £28bn Scottish Government’s Budget shows that the vast majority of public effort is spent on things other than ‘boosting GDP’: £13bn on health, £3bn on education and skills, £7bn on the communities, social security and equalities portfolio etc.
There is also nothing stopping government from using different measures of success to prioritise their efforts, if that is what they choose to do.
As with all these things, the debate can become polarised, with the debate simplified into contentious statements designed to emphasise a point.
In short, GDP is a useful measure of economic activity that can – over time – be linked with improvements in many of the outcomes that society values. But it also only captures one small element of what society should regard as success.
So what are the alternative measures?
Broadly speaking, there are two approaches to building a wider measure of
economic welfare –
- Indicators of ‘happiness’ or ‘wellbeing’, which we discuss below; and,
- A ‘good economy’ measure and/or dashboard approach, which will both be discussed in a follow-up blog.
A measure of ‘happiness’
One approach is to measure ‘wellbeing’ directly.
These typically take the form of a survey of individuals and households asking questions about life satisfaction, happiness or wellbeing.
David Cameron first asked ONS to start measuring wellbeing back in 2010.
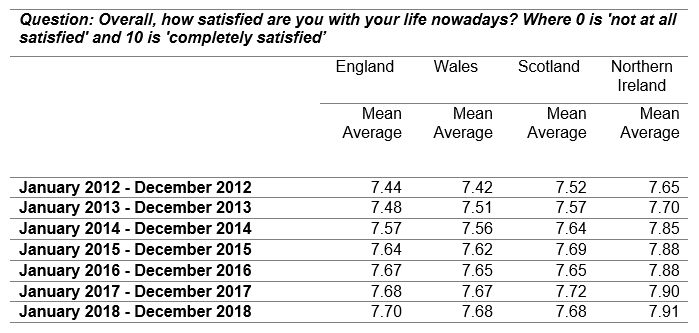
The latest results – for one measure ‘life satisfaction’ – are shown below in Table 1.
Table 1: Life satisfaction in the UK, 2012 – 2018

Source: Annual Population Survey (APS), ONS
The clear advantage of measuring wellbeing directly is that it captures what we should care most about as a society. Policies can then be traced to whether or not they improve wellbeing (or life satisfaction) both at an aggregate level and on an individual basis.
Unfortunately, such an approach suffers from a number of challenges.
An individual’s response may differ according to different personality traits, whilst when a question is asked can also have a significant impact upon any subjective assessment of wellbeing.
As the table highlights, according to the ONS measures, Northern Ireland has the highest levels of life satisfaction in the UK.
This is despite having weaker labour market outcomes, a smaller level of economic activity, higher rates of social deprivation than other parts of the UK and a fragile political environment.
This higher life satisfaction may be true of course, and may be illustrative of the changes in Northern Ireland over the last thirty years, but the result does leave one pondering what a policy strategy would look like in this instance if this was the focus of policy?
Scotland has seen the weakest growth over the time period. But what explains that?
Moreover, from a statistical point of view, it has been shown – including in a recent Journal of Political Economy paper – that comparisons of wellbeing or happiness are virtually impossible to do robustly. These are not features that there is an easy solution to, rather core flaws with this sort of comparison.
It’s also difficult to trace what may be leading to greater – or reduced – levels of wellbeing or life satisfaction.
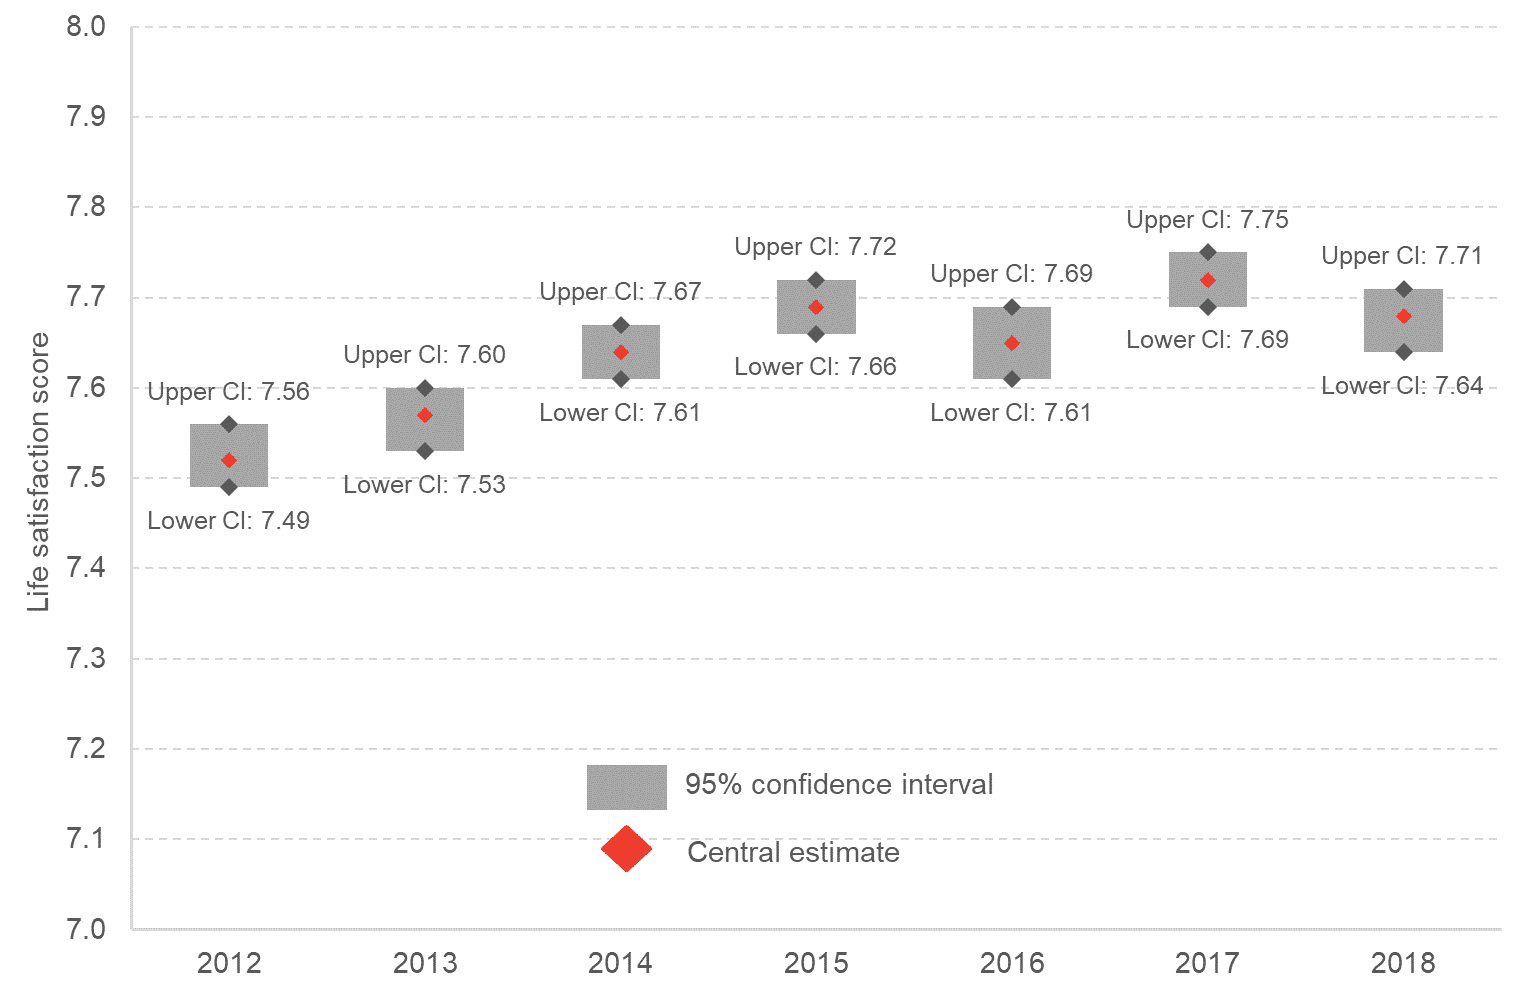
Chart 1 plots the life satisfaction average scores for Scotland, with their confidence intervals.
Chart 1: Life satisfaction in Scotland, 2012 – 2018

Source: APS, ONS
Scotland has experienced an improvement in life satisfaction over the past six years (albeit, less significant when including confidence intervals). But it fell between 2017 and 2018.
Do we know what has driven such changes? With little in the way of direct links to policy, it can be hard to reach evidence-based conclusions. The Scottish Government might argue that their policies have helped to improve wellbeing, but the UK Government might equally argue that they have been able to deliver their austerity agenda with little impact on wellbeing. Who is right?
Not being able to explain changes over time – or between countries/regions – makes understanding trends in these types of statistics difficult.
So whilst it might be easy to argue that GDP should be ditched in favour of wellbeing, the practicalities of this are easier said than done.
Authors
The Fraser of Allander Institute (FAI) is a leading economy research institute based in the Department of Economics at the University of Strathclyde, Glasgow.